Reviewing Industry 4.0 as an Enabler for Sustainable Manufacturing

Hello! My name is Allison Spring and I am a rising Junior at Northwestern University studying Environmental Engineering. This summer, I have been working collaboratively with Filippo Ferraresi and Faith John with guidance from Jennifer Dunn, Santanu Chaudhuri, and Jakob Elias to write a literature review on technology and innovations in the area of Sustainable Manufacturing and to complete a data science project. Independent of the literature review, the goal of the data science project is to train a neural network to segment fiber and air particles in Nano CT images of N95 respirators.

Sustainable Manufacturing

Due to the importance of the environmental, economic, and ethical dimensions of sustainability, a lot of research has been performed in the field of Sustainable Manufacturing. After becoming more familiar with previous literature reviews, we identified three research areas to address within the field of Sustainable Manufacturing: Material and Fuel Substitution, Industry 4.0, and Additive Manufacturing. By creating a literature review, we seek to highlight the intersections between these areas and other green and lean manufacturing practices, expose gaps in the existing literature and identify areas for future research.

Industry 4.0

By implementing existing technologies within manufacturing processes, some estimates suggest that energy consumption across the sector could be reduced by 18-26% and CO2 emissions by 19-32%. The integration of these technologies would be so revolutionary that the concept is aptly named Industry 4.0-the Forth Industrial Revolution. Figure 1 below summarizes the technological developments that have advanced manufacturing to each new paradigm.

Figure 1: Defining Enablers of the past three phases of industry and Industry 4.0 (Tesch da Silva, F. S., da Costa, C. A., Paredes Crovato, C. D., & da Rosa Righi, R. (2020). Looking at energy through the lens of Industry 4.0: A systematic literature review of concerns and challenges. In Computers and Industrial Engineering (Vol. 143, p. 106426). Elsevier Ltd. https://doi.org/10.1016/j.cie.2020.106426)

Smart Manufacturing with Industry 4.0

A lot of technologies are encompassed by Industry 4.0 including those related to Artificial Intelligence, the Internet of Things (IoT) and Cyber-Physical Systems (CPS). These technologies along with others can be applied to various levels and processes in manufacturing to predict conditions, monitor operations, and make real-time informed decisions to optimize performance or efficiency. One example of how these multiple capacities can be leveraged is for maintenance. Through simulations based on data collected with sensors connected via the Industrial Internet of Things and Cyber-Physical Systems, the wear on machining tools can be predicted. This insight into the level of wear on machining tools is valuable because replacing and repairing machining tools can, for example, improve energy efficiency and decrease the amount of waste that is created. Moreover, understanding the relationship between wear, processing conditions, and performance presents an opportunity to optimize the life of machining tools which makes these systems more sustainable.

Furthermore, while there were case studies found during the literature search that demonstrate how these feedback loops can be integrated within existing manufacturing processes, other theoretical research suggests that Industry 4.0 could contribute to a massive paradigm shift in manufacturing processes. Research on the concept of Biologicalization or biological transformation in manufacturing suggests that in the future, Industry 4.0 could allow industrial machines to imitate biological processes such as healing, calibration, and adaptation. In the analogy created by Byrne et al. between artificial and natural systems, the Internet of Things functions as the nervous system by connecting sensors, processers, and automated feedback loops.

Pre- and Post-Consumer Logistics with Industry 4.0

 In addition to this influence over manufacturing processes, Industry 4.0 technology has also been used to inform sustainable product design and to establish more agile supply chains. To start, Artificial Intelligence was applied to product design in the aviation sector to calculate a sustainability score for proposed designs based on the processes required to manufacture the design and its life cycle. Big Data combined with Machine Learning, is also valuable in supply chains. One case study used these technologies to predict environmental and social risks within a supply chain to aid human decision making.

Moreover, more theoretical publications have also considered how Industry 4.0 could be employed during the transition to a more circular economy through Reverse Logistics which considers the supply chain infrastructure that would be required to “close the loop” as shown in Figure 2. Some of the general challenges of implementing a circular economy that could be approached using Industry 4.0 include minimizing costs, waiting times, and energy consumption during remanufacturing and recycling processes.

Figure 2: Reverse Logistics to close the Loop for a Circular Economy (The Importance of Reverse Logistics in Your Supply Chain. (n.d.). Retrieved August 13, 2020, from https://www.newcastlesys.com/blog/the-importance-of-reverse-logistics-in-your-supply-chain)

Conclusion

The next step in my research is to analyze the relationship between case studies that demonstrate how manufacturing can be retrofitted with Industry 4.0 and more theoretical papers that suggest a proactive integration of Industry 4.0 into manufacturing processes. From this process, I hope to understand the trajectory and the end-state model for Industry 4.0 as well as areas where additional research is needed to support this transition.

I have really enjoyed learning more about Sustainable Manufacturing and the significance Industry 4.0 could have on manufacturing and beyond. If you, too want to learn more about this research, look out for new entries by Filippo Ferraresi and Faith John about other innovative areas in Sustainable Manufacturing!

References

Fu, Y., Kok, R. A. W., Dankbaar, B., Ligthart, P. E. M., & van Riel, A. C. R. (2018). Factors affecting sustainable process technology adoption: A systematic literature review. In Journal of Cleaner Production (Vol. 205, pp. 226–251). Elsevier Ltd. https://doi.org/10.1016/j.jclepro.2018.08.268

Tesch da Silva, F. S., da Costa, C. A., Paredes Crovato, C. D., & da Rosa Righi, R. (2020). Looking at energy through the lens of Industry 4.0: A systematic literature review of concerns and challenges. In Computers and Industrial Engineering (Vol. 143, p. 106426). Elsevier Ltd. https://doi.org/10.1016/j.cie.2020.106426

The Importance of Reverse Logistics in Your Supply Chain. (n.d.). Retrieved August 13, 2020, from https://www.newcastlesys.com/blog/the-importance-of-reverse-logistics-in-your-supply-chain

Implementing an Automated Robotic System into an AI-Guided Laboratory

Hi! My name is Sam Woerdeman, and I am a rising senior at Northwestern University, pursuing a bachelor’s degree in mechanical engineering. Through the quarantine summer of 2020, I have been working with researchers Jie Xu and Dr. Young Soo Park in implementing an automated robotic system into a nanomaterial solution-processing platform. Although I have been working remotely from home, with the help of my mentors, I have been able to conduct research nonetheless, including the simulating, programming and controlling of a robot.

Significance of Automating Nanomaterial Production

Before I dive into the importance of the robotic system, I want to acknowledge the significance of automating nanomaterial production using an AI-guided, robotic platform. For one, we would be able to understand the multi-dimensional relationships of numerous properties resulting from the production of nanomaterials and thin films. Also, we could quickly identify and improve upon the workflow of producing nanomaterials. Finally, this system would allow us to reduce human error resulting from basic intuition and reproducing the material continuously.

Differentiation from the Available Autonomous Platforms

There are a number of key elements that separate my research in implementing the robotic system from past, competing projects. Primarily, it is uncommon to mimic an entire nanomaterial laboratory autonomously. Usually, small parts of the workflow are automated and then assembled, or larger scale materials are produced autonomously. Distinctively, I am working on a modular robotic system rather than a fixed workflow. This is essential because it allows researchers to easily adjust the workflow program, rather than having to construct a unique platform for each individual solution-processing experiment. This aspect allows the programming module to be used on projects for years to come.

Approach to Implementing the Robotic System

The goal of the project is to integrate an automated robotic system into the entire solution-processing platform; I approached it from three unique angles. First, the robot has to be modeled and simulated. By utilizing CAD parts, I was able to assemble a laboratory workspace that resembles the set-up in the Argonne laboratory. The completed CAD files were imported into a simulator program called CoppeliaSim, which provides a platform for adding joints and features to allow the robot to move and interact with its environment. I want to note the importance of creating a simulator as it allows us to experiment first with different commands instead of initially risking the expensive hardware of the actual robotic system and potentially wasting time and money.

Secondly, I programmed modules for the workflow using Python as the primary programming language. In order to connect the code directly to the simulator, I used a remote API connection. An API, which is an acronym for application programming interface, allows and defines interactions between multiple software. In my case, it allows me to control the robot simulator in CoppeliaSim using Python code. By simply importing the CoppeliaSim library, I can use the functions to control the simulator and create new functions with more complex commands. Mainly, the kinematics of the robot is showcased by manipulating the motion of the joints, inputting different Cartesian coordinates for the robot to follow, and control the speed and acceleration of the robotic arm.

Example of how the joint motion function operates

Finally, I look to control the robot using my Python programming modules and simulator. While I am completing my internship remotely, the show must go on. Therefore, my mentors and I were able to remotely control the robot, which is located at our vendor’s laboratory. We did this by video chatting and connecting to the vendor’s computer using Chrome Remote Desktop. We inputted Python code, watched the simulation, and observed the robot completing the corresponding commands all from our homes. Even though we did not intend for the project to be remote, this gave us the confidence that we can control these systems from all over the world without wasting valuable time.

Remote connection of the robot using Python code and simulator simultaneously

Overall, I am amazed that I have been able to accomplish all of this in eight weeks thus far in the NAISE program, especially when considering that I am a mechanical engineering major who came into the project expecting to manually run trials with the robotic system. None of this would be possible without my mentors’, Jie Xu’s and Young Soo Park’s, assistance as well as Dr. Jennifer Dunn and Britanni Williams for keeping the NAISE program running in these strenuous times. In the coming weeks, I look to finish the library of functions for the simulator, demonstrate a basic workflow on the simulator and robot, and ultimately merge my robotic system with the artificial intelligence aspect of the project.

References

MacLeod, B.P. “Self-driving laboratory for accelerated discovery of thin-film materials” Science Advances. May 13, 2020

Social Distancing Detection

Hello there! My name is Ori Zur and I am a rising junior at Northwestern University studying computer science and music composition. This summer at Argonne, I sought to answer the following question: how well are people following social distancing guidelines in outdoor urban environments?

For the past six months, the world has been enduring a historic pandemic due to the COVID-19 virus. As society attempts to adjust to the new lifestyle of mask wearing, virtual education, and working from home, one phrase that constantly gets brought up is “social distancing guidelines.” Social distancing is the action of keeping a distance of at least six feet from others in order to reduce the spread of the Coronavirus disease. For the past two months, I’ve been designing and coding a social distancing detector using Python and OpenCV as a means to answer the question of what percentage of people are properly following these social distancing guidelines.

The program takes a video of pedestrians, typically from surveillance camera footage, and analyzes each frame by detecting the people, calculating the distance between each pair of people, and indicating if any two people are standing less than six feet apart. OpenCV, a computer vision function library, was used because it greatly simplifies the process of loading in a video, separating it into individual frames for analysis and editing, and outputting the final results.

How It Works

There are two main components to the program: the setup, which only occurs once in the beginning, and the operation, which is a loop that occurs once for each frame of the input video.

The Setup

When the program begins running, the first frame of the input video is shown to the user. The user then inputs six points with their mouse. The first four points make up a rectangle on the ground plane, which will be referred to as the “region of interest” or ROI. The last two points are an approximation of a six-foot distance on the ground.

Six mouse points inputed by the user on the first frame of the input video. The four blue points make up the region of interest and the two green points are the six-foot approximation. Here, the height of the person was used to approximate six feet, but ideally there would be markers on the ground to help guide the user in plotting these points.

The purpose of creating a region of interest with the first four mouse points is to solve the issue of camera distortion. Because the camera is filming from an angle, the conversion rate between physical distance on the ground and pixel distance in the image is not constant. In order to solve this problem, the four mouse points are used to warp the region of interest to create a bird’s-eye-view image. This new image, shown below, looks distorted and unclear, but its appearance is irrelevant as it won’t be shown to the user. What’s important is that in the warped image, the conversion rate between physical distance and pixel distance is now constant.

Original Image
Warped Bird’s Eye View Image

In order to prove that this works, I created a small-scale experiment using LEGOs and ran the image through the same warping function. On the left, the tick marks on the sides of the paper are not evenly spaced in terms of pixel distance due to the camera angle. On the right image, however, the tick marks on the side of the paper are evenly spaced, indicating that the physical distance to pixel distance conversion rate is now constant.

Left: original image, four blue points are inputed by the user via mouse clicks.
Right: result of image transformation.

The last part of setup is to use the last two inputted mouse points to calculate the number of pixels that make up six feet. The coordinates of these two points are warped using the same function used to warp the image, and the distance formula is used to calculate the number of pixels between them. This distance is the number of pixels that make up six feet, which I call the minimum safe distance, and since the points and image were warped using the same function, this pixel distance is the same throughout the entire bird’s-eye-view image.

The Operation

The first step of the operation loop is person detection, which is accomplished using a real-time object detection program called You Only Look Once, or YOLO. This program recognizes a wide variety of objects, but my program includes a filter that only keeps the person recognitions. Once detection occurs, each person is represented by what’s called a “bounding box,” which is a rectangle whose coordinates surround the person.

The next step is to take a single point from each bounding box, warp it using the same function used in the setup, and map the coordinates of the warped box points onto the bird’s-eye-view image. Because everything is now mapped onto the bird’s-eye-view image, the distance formula can be used to calculate the distances between each pair of points. These distances are then compared to the minimum safe distance which was also calculated in the setup.

The final step is to create and display the outputs for the current frame. The first output is the street view, where red and green rectangles are drawn on the bounding boxes of the detected people. The second output is a representation of the bird’s-eye-view image using a white window and green and red circles to represent the warped box coordinates that were mapped in the previous step. Once the outputs are displayed, the loop moves onto the next frame of the input video.

Screenshot of the program in action.
Left: bird’s-eye-view output
Right: street view output

Here is a flowchart that summarizes the steps of the setup and operation components of the program.

Setup steps are in orange and operation steps are in green.

Next Steps

One feature that I plan to add to the program in my remaining time at Argonne is the ability to detect groups of people walking together. For example, a couple or family walking together may be less than six feet apart, but that should not be considered a violation of social distancing guidelines. This will be done by adding in an algorithm that can associate objects across multiple frames and assign unique IDs to each person detected. Using this algorithm, my program will be able to recognize groups of people walking together by tracking their specific object IDs, and disregard them as violators even if they are standing too close together.

References

  1. https://github.com/deepak112/Social-Distancing-AI
  2. https://github.com/aqeelanwar/SocialDistancingAI
  3. https://www.pyimagesearch.com/2020/06/01/opencv-social-distancing-detector/
  4. https://www.pyimagesearch.com/2014/08/25/4-point-opencv-getperspective-transform-example/
  5. https://www.pyimagesearch.com/2018/11/12/yolo-object-detection-with-opencv/

Automatic Wildfire Smoke Detection Using Deep Learning

Hi friendly reader! My name is Aristana Scourtas, and I’m currently pursuing my MS in Artificial Intelligence at Northwestern University. I have two years of industry software experience and a dream to apply my computing skills to environmental and climate change-related issues. This summer I’m committed to finding novel solutions to an old problem — early detection of wildfires.

Fire moves fast

The early detection of smoke from wildfires is critical to saving lives, infrastructure, and the environment — and every minute counts. Once ignited, a fire can spread at speeds of up to around 14 mph1 — that’s about 2.3 miles every 10 minutes! The devastating Camp wildfire that tore through northern California in 2018 moved at more than a football field per second (160 ft/s) at its fastest point.2

The Camp Wildfire (Nov 8th, 2018), imaged via Landsat 8, a NASA/USGS satellite.3

So how can we do this? Currently, wildfires are detected any number of ways: in California, wildfires are typically first recorded via 911 (a US emergency hotline) calls4, but we also detect wildfires via fire watchtowers or by camera networks and satellite images (like from the GOES5 or VIIRS6 satellites) that inspect areas of interest. In all of these cases, a person needs to continually monitor the data streams for signs of smoke and fires.

However, human beings can only do so much. Continuously monitoring multiple video feeds for fires is a fatiguing, error-prone task that would be challenging for any person.

But how about a computer?

What deep learning can do

Deep learning is a subset of machine learning that focuses specifically on neural networks with a high number of layers. Machine learning is really good at doing things humans are typically bad at, like rapidly synthesizing Gigabytes of data and finding complicated patterns and relationships.

A simple neural network with only one hidden layer. We’d call this a “shallow” neural network. (Graphic modified from V. Valkov)8

Neural networks are said to be “universal approximators”,7 because they can learn any nonlinear function between an input and an output — this is very helpful for analyzing the patterns and relationships in images, for example.

Deep learning algorithms are good for the task of smoke detection, because they can constantly and automatically “monitor” the image and video streams from fire watchtower networks and satellites, and alert officials when there’s likely smoke in the image.

Current algorithms

As I’m writing this article, the current research out there on deep learning for wildfire smoke detection largely focuses on using Convolutional Neural Networks (CNNs) for static images. CNNs are commonly used for image data, and are good at learning spatial information.

For example, in my smoke detection research, we’re working with an image dataset from the HPWREN9 tower network in southern California.

An example HPWREN image capturing smoke. This image, after it is pre-processed for the neural network, is then fed to the CNN as input.

Unfortunately, while these CNN-based algorithms usually have high accuracy, they can also produce a high number of false positives, meaning they mistake other things, like clouds or fog, for smoke.

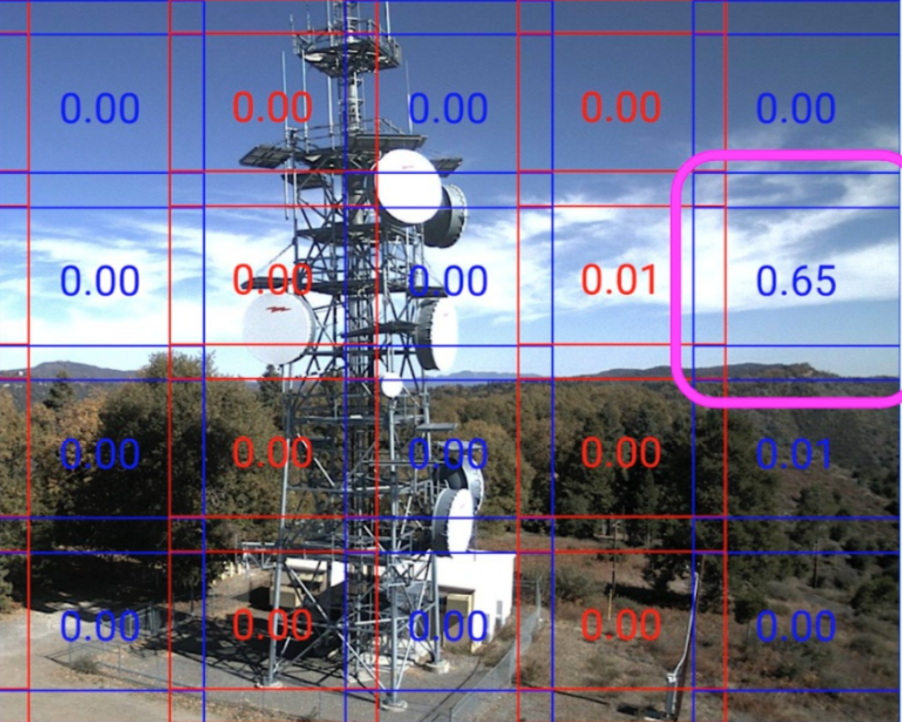
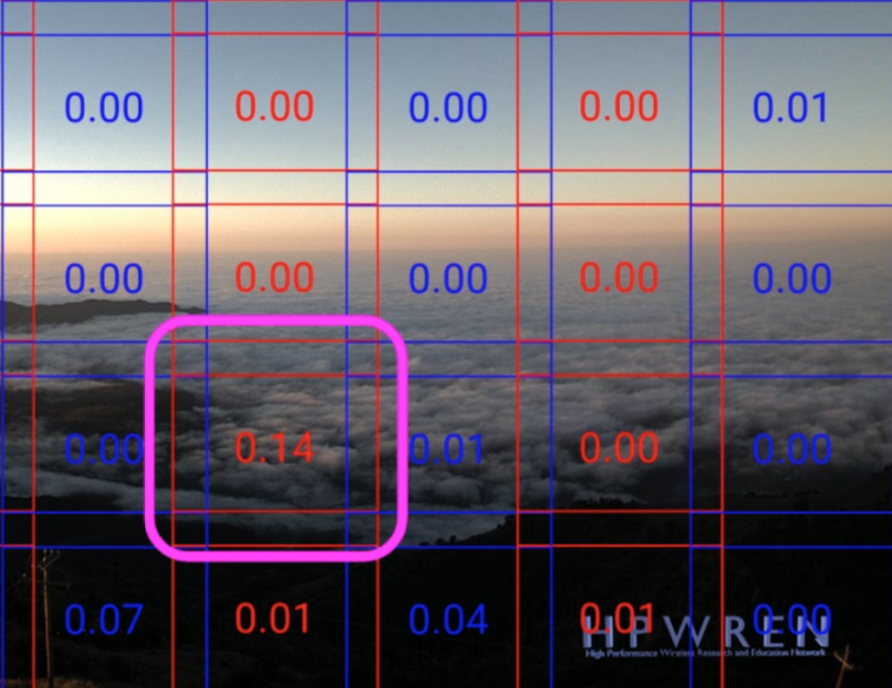
Examples of false positives from the work of Govil et al in their 2020 paper. This model divided the image into a grid, and assigned the likelihood of each grid cell being smoke (the threshold for smoke was adjusted dynamically).4 On the left, clouds were mistaken for smoke. On the right, fog was mistaken for smoke.

Furthermore, while these models do well in their studies, oftentimes they do not perform well when assessed with images from other regions. For instance, the ForestWatch model, which has been deployed in a variety of countries such as South Africa, Slovakia, and the USA, did not perform well when assessed using data from Australian watch towers.10

This begged the question: “well, how do humans detect wildfire smoke?” Looking through the dataset of images of California landscapes, I often found I could not tell if there was smoke in any of the early images.

Can you find the smoke in this image from the HPWREN towers? It was taken 9 minutes after the smoke plume was confirmed to be visible from the tower.
(Answer: from the left of the image, it’s 1/3 of the way in)

I’d only see the smoke once I compared images sequentially, from one timestamp to the next. Intuitively, movement on or below the horizon seemed to be a key aspect of recognizing smoke.

Is time the secret ingredient?

After listening to the opinions of my mentors and a California fire marshal, it seemed like everyone agreed — movement was a key part of how we identified smoke.

Could we create a model that learns temporal information as well as spatial information? In other words, could it learn both what smoke looked like (spatial), and how the images of smoke changed over time (temporal)?

I’m now developing an algorithm that can do just that. Often, a Long Short-Term Memory network (LSTM), which is a kind of Recurrent Neural Network (RNN), are used for learning patterns over time (i.e. in sequential data). For instance, LSTMs are frequently used for text prediction and generation (like that in the Messages app on iPhones).

Models that combine spatial data (often learned via CNNs) with some other model or technique that captures temporal data have been used in a variety of other applications with video or sequential image data, such as person re-identification, object tracking, etc.

We’re exploring how we can apply a similar hybrid spatial-temporal model to our smoke dataset.

Conclusion

Automated early detection of wildfire smoke using deep learning models has shown promising results, but false positive rates remain high, particularly when the models are deployed to novel environments.

Including a temporal component may be a key way we can improve these models, and help them distinguish better between smoke and clouds or fog.

This work doesn’t come a moment too soon, as wildfires are increasing in intensity and frequency due to climate change’s effects on air temperature, humidity, and vegetation, among other factors. Unfortunately, fires like the ones that tore across Australia earlier this year will become much more common in many parts of the globe.

Hopefully, as we improve the technology to detect these fires early on, we can save lives and ecosystems!

The Amazon Rainforest, home to many peoples and countless species. A home worth protecting.

References

  1. “How Wildfires Work”. https://science.howstuffworks.com/nature/natural-disasters/wildfire.htm
  2. “Why the California wildfires are spreading so quickly”. https://www.cnn.com/2018/11/09/us/wildfires-why-they-spread-so-quickly-wcx/index.html
  3. Camp Fire photo. https://en.wikipedia.org/wiki/Camp_Fire_(2018)
  4. Govil, K., Welch, M. L., Ball, J. T., & Pennypacker, C. R. (2020). Preliminary Results from a Wildfire Detection System Using Deep Learning on Remote Camera Images. Remote Sensing12(1), 166. https://www.mdpi.com/2072-4292/12/1/166
  5. GOES. https://www.nasa.gov/content/goes-overview/index.html
  6. VIIRS. https://ncc.nesdis.noaa.gov/VIIRS/
  7. Scarselli, F., & Tsoi, A. C. (1998). Universal approximation using feedforward neural networks: A survey of some existing methods, and some new results. Neural networks11(1), 15-37. https://www.sciencedirect.com/science/article/pii/S089360809700097X?casa_token=NaZxQdSUi6MAAAAA:zMhRIkTNDTZWSWze5wIHVK73EtlgHzLm3cAMkRBpQmepxH3cSAyhIvPKpu_H5b-2kYdTcG1IQA
  8. NN graphic. https://towardsdatascience.com/build-a-simple-neural-network-with-tensorflow-js-d434a30fcb8
  9. HPWREN. http://hpwren.ucsd.edu/cameras/
  10. Alkhatib, A. A. (2014). A review on forest fire detection techniques. International Journal of Distributed Sensor Networks10(3), 597368. https://journals.sagepub.com/doi/full/10.1155/2014/597368
  11. Amazon Rainforest photo. https://www.telegraph.co.uk/travel/destinations/south-america/articles/the-amazon-travel-guide/