Questions?
Overview
Recent additions to the Hardware/Hybrid Accelerated Cosmology Code (HACC) [Ref 1] framework allow for more detailed cosmology simulations. With the addition of baryonic matter [Ref 2], and a mechanism for designating particles as Active Galactic Nuclei (AGN), new forms of visualization are now possible.
These simulations are used to study the impact that feedback from AGN have on their surrounding matter distribution. AGNs are associated with violent bursts of energy that result from matter accretion onto supermassive black holes forming at the center of galaxies. Visualizing the temperature field of the baryon particles shows how this energy is imparted to the surrounding gas and affects subsequent structure formation. One can also examine entropy, which is a physical quantity acting as a thermodynamic record of heating and cooling processes during structure formation. Hence, the entropy contains a wealth of information regarding the various astrophysical processes that occurred during the formation of massive objects. Cosmological simulations that model feedback from AGN as well as other astrophysical phenomena including radiative cooling, star formation, and supernovae feedback are critical in understanding the structure formation history of the universe.
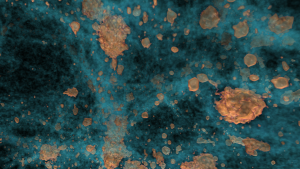
Figure 1. This visualization shows a small portion of a cosmology simulation tracing structure formation in the universe. The gold-colored clumps are high-density regions of dark matter that host galaxies in the real universe. This BorgCube simulation was carried out on Theta by the HACC team as part of the ALCF’s Theta Early Science Program. This image was created with the vl3 framework (Argonne) using the global illumination algorithm described in [Ref 5]. Simulation and Data: The HACC team (Argonne National Laboratory). Visualization: Joseph Insley, Silvio Rizzi (Argonne National Laboratory)
Data
- The dataset is from a CRK-HACC cosmological simulation containing 2×643 dark matter plus baryon particles in a cubic box of side length 64 Mpc/h. Particles contain multiple fields, including position, velocity, temperature, etc.
- The simulation evolved from z = 200 (universe was 5 million years old) to z = 0 (today), thus multiple timesteps are available to visualize time evolution.
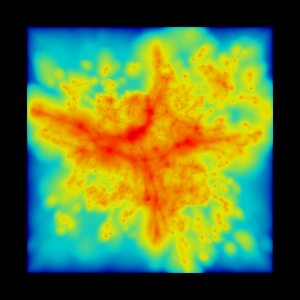
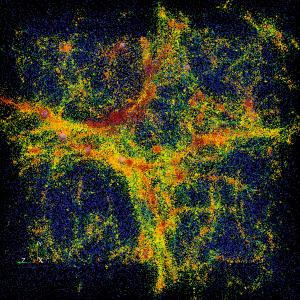
Figure 2. Left: Temperature map generated with an SPH interpolation kernel. Right: Particles rendered through ParaView. The larger spheres are AGN particles. Simulation and Data: The HACC team (Argonne National Laboratory). Visualization: Joseph Adamo (University of Illinois – Urbana-Champaign)
Tasks
Provide a summary of information in the data set. The summary can be in any form deemed useful in describing the data set. This could include renderings, plots, scalars, narratives, etc. The contest will reward creativity in exploration and interpretation of the data. Science and art will be rewarded as will techniques that enable analysis.
Exploring visualization techniques is encouraged. There are multiple methods that may work well with this dataset, including (1) Visualizing dark matter and baryonic density by accumulating particles in a regular grid (Figure 1); (2) Visualizing temperature using SPH interpolation kernels (Figure 2)[Ref 4]; (3) Visualizing particles as points (Figure 3)[Ref 4] or point sprites [Ref 3] ; (4) Combining multiple visualization modalities for dark matter density, baryonic density, and AGNs (Figure 4).
As an additional challenge, participants are also encouraged to attempt visualization of derived quantities such as entropy S = ln ( T / p ^ (2/3) ), where T is the temperature field and p represents density.
Participants will be rewarded for creating an animation showing the time evolution of the simulation and illustrating the visualization techniques used.
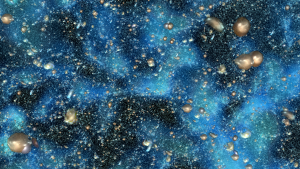
Figure 3. Flying Through the SPHEREx Sky. SPHEREx is a proposed NASA Medium Explorer (MIDEX) mission. It is an all-sky spectral survey which will observe the entire sky multiple times during its planned two-year mission, producing a near-infrared spectrum with a pixel resolution of 6 arcseconds. The synthetic galaxy catalog is based on the trillion-particle “Outer Rim” simulation carried out with the HACC code on Mira at the Argonne Leadership Computing Facility. This visualization shows a small part of the SPHEREx sky, combining point, volume, and glyph rendering to represent dark matter density and galaxies. Image rendered with ParaView running on Cooley at Argonne National Laboratory. Simulation/Project credits: HACC (Argonne National Laboratory) and SPHEREx (JPL) teams. Galaxy info: Jonas Chaves-Montero (Argonne National Laboratory), Shoubaneh Hemmati (Caltech/IPAC). Visualization: Joseph Insley, Silvio Rizzi (Argonne National Laboratory)
Judges
- Silvio Rizzi, Visualization and Analysis, Argonne National Laboratory.
- JD Emberson, HACC team, Argonne National Laboratory.
- Joseph Insley, Team Lead, Visualization and Analysis, Argonne National Laboratory.
- Katrin Heitmann, HACC team, Argonne National Laboratory.
- John Patchett, Deputy Team Lead, Data Science at Scale, Los Alamos National Laboratory.
- Theresa-Marie Rhyne, editor of the Visualization Viewpoints Department for IEEE Computer Graphics & Applications Magazine, Associate Editor of IEEE Computing Now.
Important Dates
- October 24, 2018 – Official announcement of the 2019 Scientific Visualization Contest.
- August 15, 2019, Anywhere On Earth (AOE) – Deadline for entry submissions.
- August 31, 2019 – Notifications sent out to participants.
- Official announcements of results at IEEE Visualization 2019.
References
- S. Habib, A. Pope, H. Finkel, N. Frontiere, K. Heitmann, D. Daniel, P. Fasel, V. Morozov, G. Zagaris, T. Peterka, et al. Hacc: Simulating sky surveys on state-of-the-art supercomputing architectures. New Astronomy, 42:49–65, 2016.
- N. Frontiere, C. D. Raskin, and J. M. Owen. Crksph–A conservative reproducing kernel smoothed particle hydrodynamics scheme. Journal of Computational Physics, 332:160–209, 2017.
- S. Rizzi, M. Hereld, J. Insley, M. E. Papka, T. Uram, and V. Vishwanath. Large-scale parallel visualization of particle-based simulations using point sprites and level-of-detail. In Proceedings of the 15th Eurographics Symposium on Parallel Graphics and Visualization, pp. 1–10. Eurographics Association, 2015.
- J. Adamo, J.D. Emberson, E. Brooks, S. Rizzi, J. Insley, M.E. Papka. Exploring Visualization Techniques with HACC Simulation Data. In Large Data Analysis and Visualization (LDAV), 2018 IEEE 8th Symposium on. IEEE, 2018.
- M.Shih, S. Rizzi, J. Insley, T. Uram, V. Vishwanath, M.E. Papka, K.L Ma. Parallel distributed, gpu-accelerated, advanced lighting calculations for large-scale volume visualization. In 2016 IEEE 6th Symposium on Large Data Analysis and Visualization (LDAV) (pp. 47-55). IEEE, 2016.