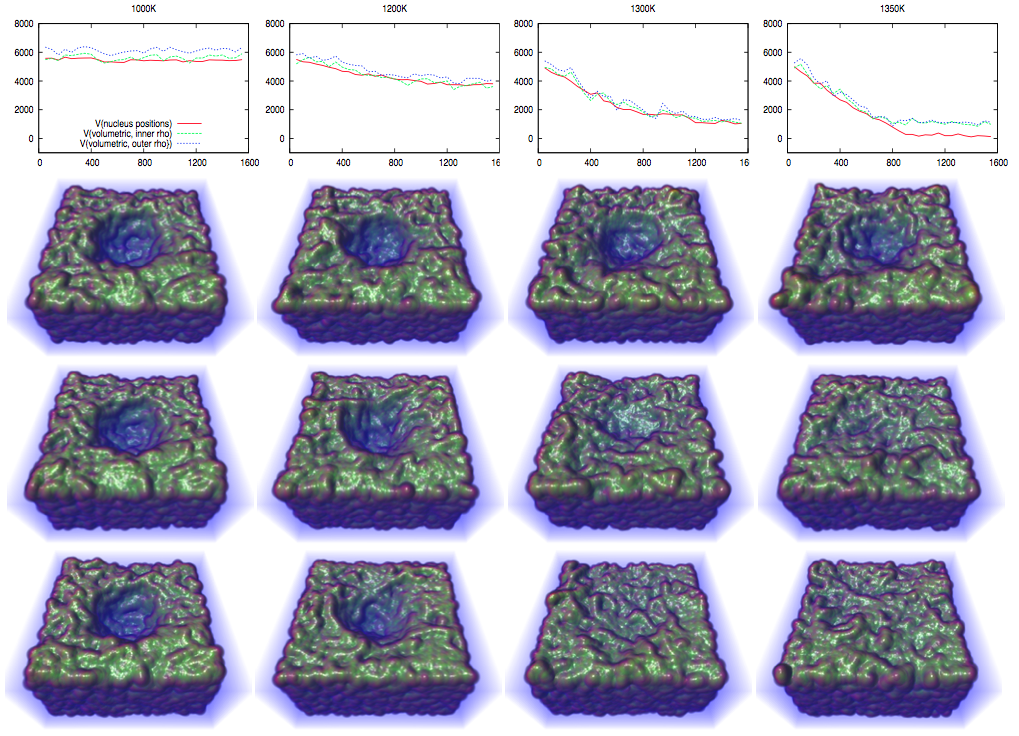
Nanobowls
Bin Liu, Maria K.Y. Chan and Jeffrey Greeley at the ANL Center for Nanoscale Materials (CNM) at Argonne are interested in using novel amorphous aluminum oxide (Al2O3) nanostructures, “nanobowls”, as multipurpose catalyst supports. The stability of synthesized nanostructures under reaction conditions is a key for the applications. Atomic diffusion is modeled on nanobowls consisting of 10,000 – 20,000 atoms using DL POLY, a molecular dynamics (MD) code. The goal of the visualization and analysis group is to determine which structures are stable, given different bowl radii and temperatures. To accomplish this, we generate an approximate charge density field, based on per-atom radial basis functions suggested by charge density plots from density functional theory (DFT) simulation on the bulk compound. We perform automatic registration and segmentation of volume data to determine the material interface boundaries. We employ an uncertainty classification technique driven by our charge density model to conduct analysis, such as estimation of surface area and void space volume, on this model. We visualize these results with volume rendering. We find that our numerical results correlate strongly to those of raw positional data, but more accurately account for surface science particularly for simulations at higher temperatures.
CO Adsorption in Catalysis
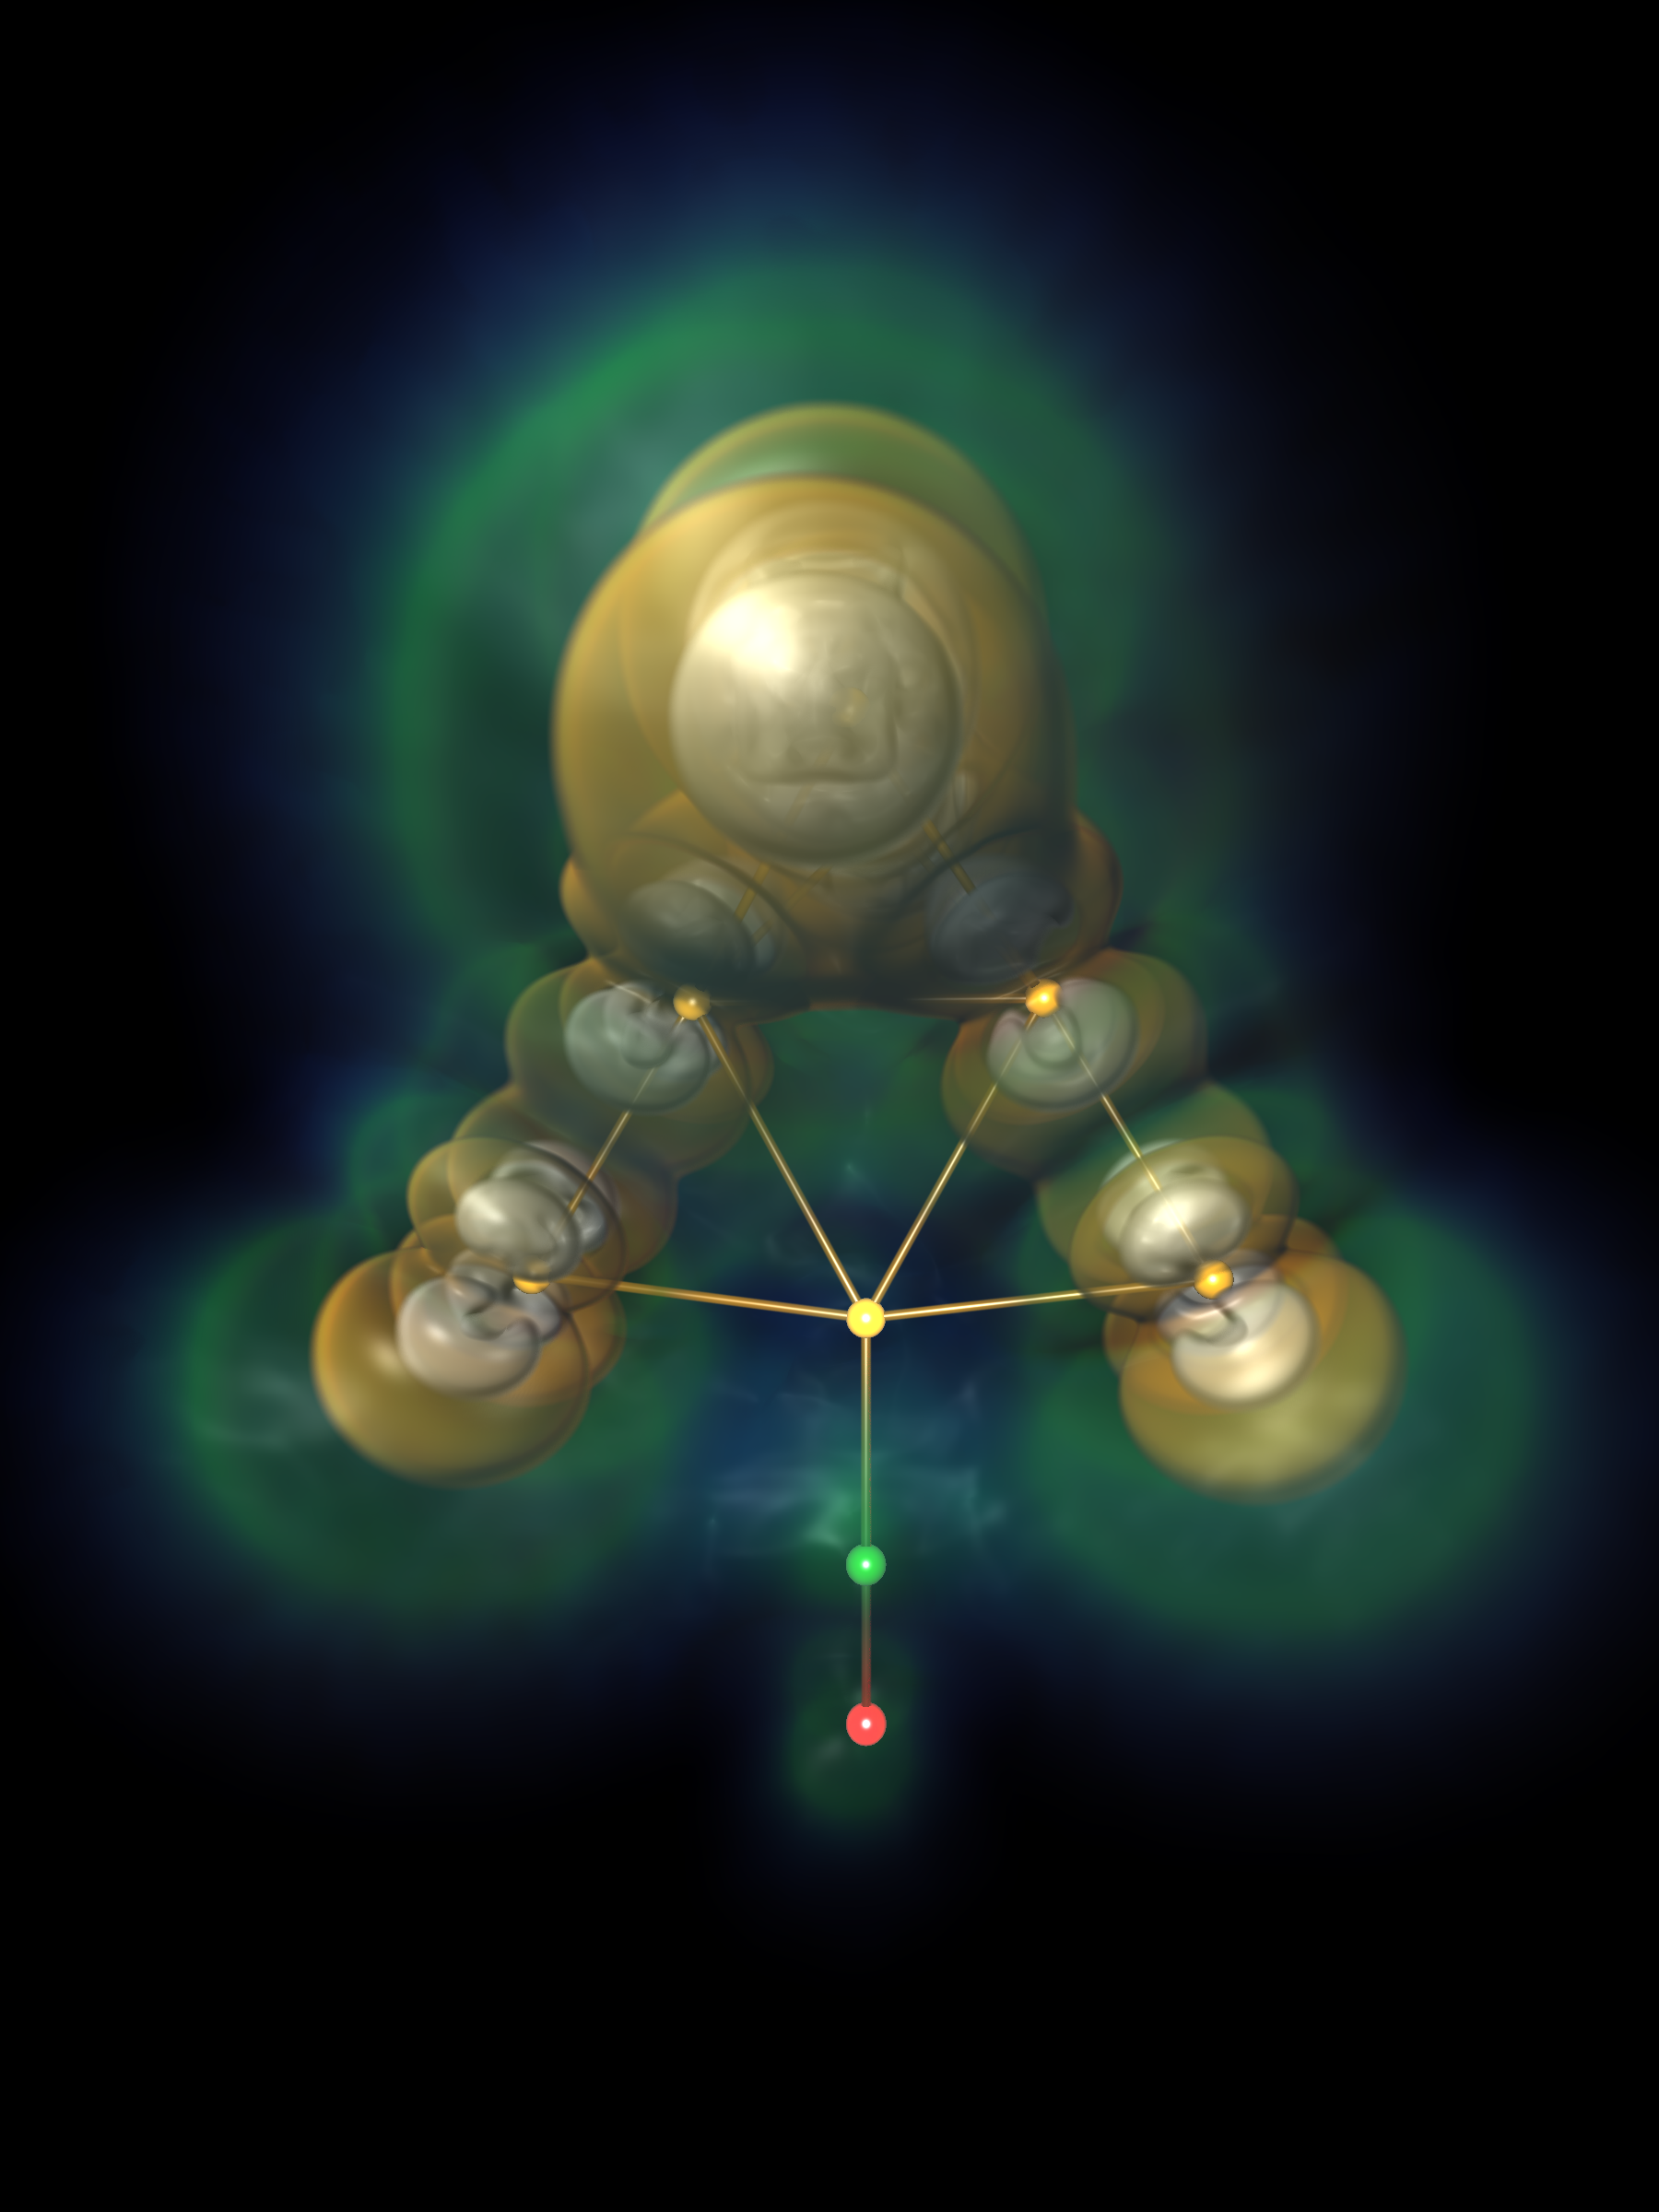
DFT simulation of CO adsorption in a Platinum catalyst.
We used Nanovol to render data directly from density functional theory (DFT) simulation. The work shown above examines the bonding energetics of CO adsorption, using the NWChem package. The output is a volumetric charge density field corresponding to molecular orbitals. The goal of this effort is to understand why carbon monoxide acts as a poisoning agent on certain catalysts (namely Platinum, as in this example), but not on others. Volume visualization is helpful in understanding the geometry of molecular orbitals as well as atom positions. Due to the low resolution of volume data output from NWChem, we use a tricubic spline filtering to reconstruct smooth data without losing features. While, more descriptive than isosurfaces, we find a single volumetric field (such as density of the highest-occupied molecular orbital) does not fully describe bonding behavior. We are investigating multifield options for classifying and visualizing molecular orbitals data.
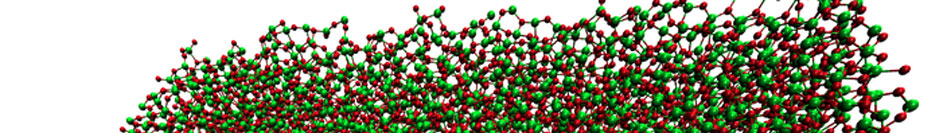
Amorphous Carbon “Supersoot”
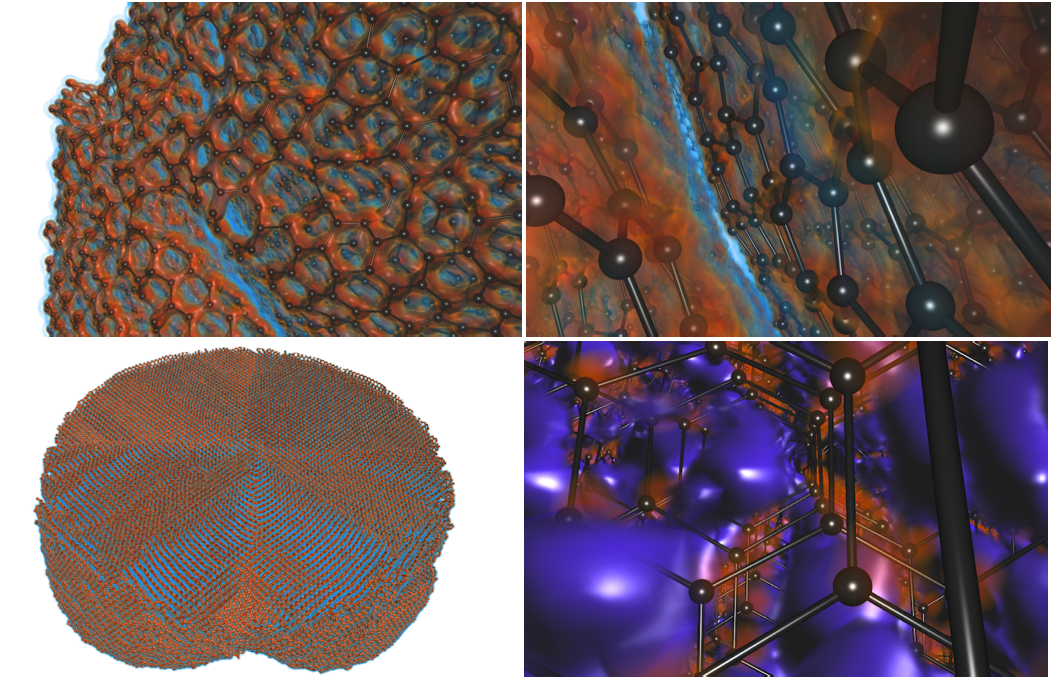
Amorphous carbon “supersoot” structures resulting from thermal annealing, visualized with uncertainty classification in Nanovol.
Under the Center for Electrical Energy Storage EFRC, Vilas Pol at Argonne National Laboratory Materials Science Division (MSD) is experimenting with amorphous carbon structures usable as anode material in battery technology. These carbon structures are byproducts of combustion of plastics and similar organic compounds. Appearing as ordinary soot to the human eye, they in fact consist of diamond cores surrounded by sheaths of graphite. The graphite layers excel at trapping Lithium ion electrolyte, resulting in an effective battery from recycling processes. Alongside experimental synthesis, Kah Chun Lau and Larry Curtiss at MSD perform molecular dynamics simulation in LAMMPS on ALCF’s IBM BlueGene/P, Intrepid. The goal is to understand which processes result in optimal electrolyte storage material. MD supersoot simulations generate moderately large geometry, which is cumbersome to visualize solely as ball-and-stick models. With Nanovol, we again used radial basis functions to generate an approximate charge density model. Even though this does not define an exact surface, we can use known properties of carbon and lithium (e.g. Van der Waals and ionic radii) to estimate and visualize void space, and hence the propensity of supersoot structures to store lithium.
Display Hardware
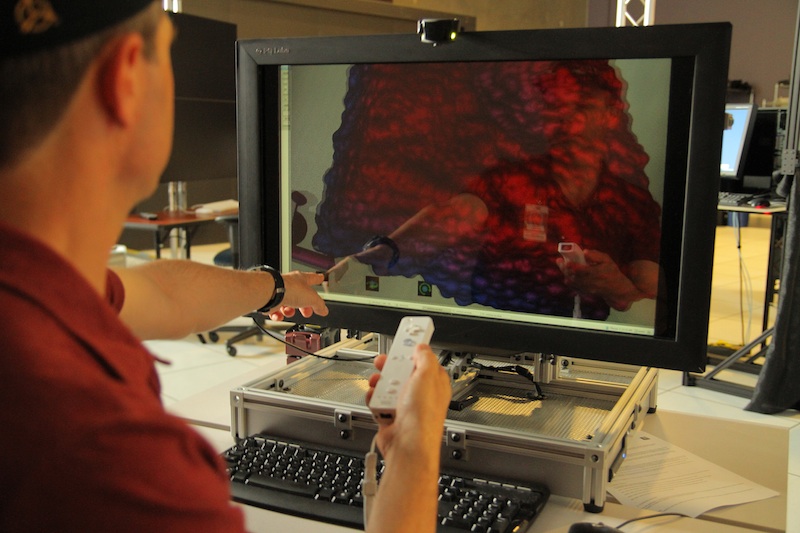
Dynallax autostereo display.
Dynallax offers a novel immersive workstation environment for scientific exploration. It is a workstation environment that scientists can use daily as both a data exploration platform and as a standard computer. Our implementation is an autostereoscopic dynamic barrier that offers a 2D/3D display, interactive input devices, and a software infrastructure called DVC that allows client/server components to connect the workstation to scientists’ visualization applications. By coupling through DVC to scientists’ existing visualization tools, as well as those developed by Aaron Knoll as part of this project, Dynallax allows scientists to use workflows and tools that are most effective for their research.
Display Software
Ball-and-stick rendering and comparative visualization of void space benefit greatly from the improved depth perception. We have integrated our Nanovol software with Dynallax, an automated head-tracking stereoscopic display developed by Tom Peterka at the Argonne National Laboratory Mathematics and Computer Science (MCS) division. Stereo workstations could prove useful in a variety of interactive materials modeling tasks. In particular, we are interested in applying stereo environments to comparative visualization of surface features, and modeling initial geometry prior to DFT computation such as the CO binding energetics study.