Integrating Darshan into SPOT for ATLAS Production Workflow Monitoring

[note: I’m just posting; Orcun Yildiz and Rui Wang did all the work and contributed this writeup. Check out Part 1: Darshan for HEP: A Case Study in Characterizing ATLAS I/O Behavior while you’re here for additional context]

The Darshan team and collaborators in the HEP-CCE/SOP group recently completed an integration of Darshan into SPOT, the ATLAS experiment’s release-level performance monitoring tool. This article describes why we pursued the integration, how we carried it out, what the data revealed about ATLAS I/O behavior, and how continuous Darshan metrics are now helping detect performance regressions introduced by software changes.

Background

The Software Performance Optimization Team (SPOT) is a dedicated working group within the ATLAS Experiment at CERN. Its primary mission is to monitor, profile, and optimize the Athena software framework and computing infrastructure to handle massive data processing workloads efficiently. As an infrastructure, SPOT tracks the computational performance of Athena across software releases by running representative workflows and recording performance metrics over time, enabling release managers to detect regressions introduced by software changes.

Before we integrated Darshan, SPOT relied primarily on Prmon for job-level CPU and memory metrics and used resource-intensive tools such as VTune and Valgrind for targeted deep profiling. These tools provided high-level performance insights but lacked lightweight, continuous I/O monitoring at the process and thread level—a gap Darshan was designed to fill.

Motivation

Several factors motivated the integration of Darshan into SPOT:

  1. Demonstrated diagnostic value. The preliminary studies had revealed significant, previously unknown I/O inefficiencies, but there was no way to track them across releases.
  2. HPC deployment. ATLAS is deploying workflows on HPC platforms at NERSC, OLCF, and ALCF, where I/O performance characteristics differ markedly from traditional grid storage. Understanding how ATLAS I/O patterns interact with parallel file systems like Lustre and GPFS required continuous monitoring.
  3. Storage format transition. The ongoing transition from ROOT’s TTree format to RNTuple promised improved read performance through better data locality and compression, but the actual impact on production workflows needed to be measured empirically across the transition period.

Integration

Darshan can be deployed as a transparent interposition library (loaded via `LD_PRELOAD` or linked at build time), which makes it possible to add I/O instrumentation to existing workflows through environment configuration alone. The relevant Darshan environment variables include:

  • LD_PRELOAD pointing to the Darshan shared library
  • DARSHAN_LOG_DIR_PATH specifying where logs should be written
  • DXT_ENABLE_IO_TRACE to activate extended tracing when full operation-level detail is needed

Enabling Darshan in SPOT Workflows

To incorporate Darshan into SPOT, we modified the test execution infrastructure on the dedicated runtime environment nodes to transparently manage and inject Darshan configurations. The orchestration system automatically initializes the local runtime environment using a shared distributed file system (CVMFS) to load the unified, pre-configured experiment software stack.

During job preparation, the orchestrator sets up environment variables (DARSHAN_BASE_DIR, DARSHAN_LOGPATH, and DARSHAN_CONFIG_PATH) to load and configure the profiling tool. It dynamically injects the Darshan shared library via runtime preloading parameters directly into the ATLAS offline software (Athena) processes at runtime using command-line arguments.

The tracking runs systematically target highly I/O-intensive, multi-process data derivation and reduction tasks across a $2 \times 2$ matrix of execution configurations, typically using 16 parallel processes to process 1,000 events per process:

  1. ROOT TTree Storage format with a Shared Writer: A configuration where a dedicated writer process handles serial file writes on behalf of all workers.
  2. ROOT TTree Storage format with Shared Writer & Parallel Compression: Where worker processes handle data compression in parallel threads before passing the compressed payloads to the shared writer.
  3. ROOT RNTuple Storage format with a Shared Writer: Utilizing a modern, highly optimized columnar storage format instead of legacy formats to evaluate streaming write efficiency.
  4. ROOT RNTuple Storage format with Parallel Compression: Combining the upgraded database format with parallelized worker compression to maximize throughput.

Because the underlying multi-process framework dynamically forks worker processes at runtime, we developed a helper mapping utility that reads the operating system process IDs (PIDs) from the Darshan log headers and maps them to their logical application roles (e.g., worker process, shared writer process, or event counter process). The final diagnostic logs and execution arguments are archived in shared storage, and log details are published directly to the monitoring platform’s web area.

Post-Processing and Visualization

The post-processing and visualization pipeline uses a dedicated scripting inside the SPOT repository. Its utility manages the execution of multiple diagnostic tools to provide release managers with detailed, multi-dimensional performance insights:

  • Trend Plots: Standard scatter plot over software releases. It generates metrics such as total read/write bytes (POSIX_BYTES_READ/POSIX_BYTES_WRITTEN) for input and output datasets, general file operation counts (such as POSIX_OPENS, POSIX_FILENOS, POSIX_SEEKS, POSIX_STATS), and consecutive/sequential access metrics (POSIX_CONSEC_READS, POSIX_SEQ_READS). It also isolates metrics per logical worker role (e.g., comparing the writer process write volume to the compute worker read volume) and tracks cumulative write/read times versus bytes processed. Additionally, it visualizes memory alignment issues by querying POSIX_MEM_NOT_ALIGNED.
  • Timeline File Trace Plots (for experts only): Visualizes the full file trace over time, charting dynamic I/O operations relative to the runtime timeline.
  • Detailed I/O Trace Histograms: Using Darshan eXtended Tracing (DXT) to produce duration-versus-length distributions (e.g., comparing write_durations vs write_lengths) categorizing behavior across our matrix of configurations (comparing TTree and RNTuple formats with or without parallel compression) for specific processes.

Fig. 1: Dashboard Screenshot from the SPOT monitoring website showing performance metrics over several software releases

Ongoing Reread Integration

While basic I/O summary statistics are now fully integrated into the SPOT database and dashboards, continuous parsing and plotting of logical reread profiles are still being integrated. The aim is to move the reread diagnostic suite from independent, local post-processing scripts into SPOT’s nightly monitoring pipeline. This integration includes the standard scatter plot over software releases to track the total reread volume across serial and 8-thread jobs. Fig. 2 is an example generated locally.

Fig. 2: Total reread per nightly release for serial and 8 threads jobs 

Takeaways

The integration of Darshan into SPOT demonstrates that lightweight, continuous I/O characterization can be practically deployed within a large experiment’s existing performance monitoring infrastructure. The overhead is negligible, the logs are compact, and the resulting metrics fill a critical gap in understanding workflow performance.

This work provides a scalable methodology for detecting and diagnosing I/O bottlenecks, guiding workflow optimization, and improving resource utilization of HEP experiments as data volumes and HPC concurrency continue to grow in the exascale era and beyond.

Further details, including the SPOT monitoring dashboards and the integration code, are available at https://atlaspmb.web.cern.ch/atlaspmb/spot-mon-darshan/ and https://gitlab.cern.ch/atlaspmb/PerformanceMonitoring/-/tree/master/perf .
Darshan for HEP: A Case Study in Characterizing ATLAS I/O Behavior

[note: I just posted the content: Orcun Yildiz https://www.anl.gov/profile/orcun-yildiz contributed this article describing the work he did with Rui Wang https://www.anl.gov/profile/rui-wang ]

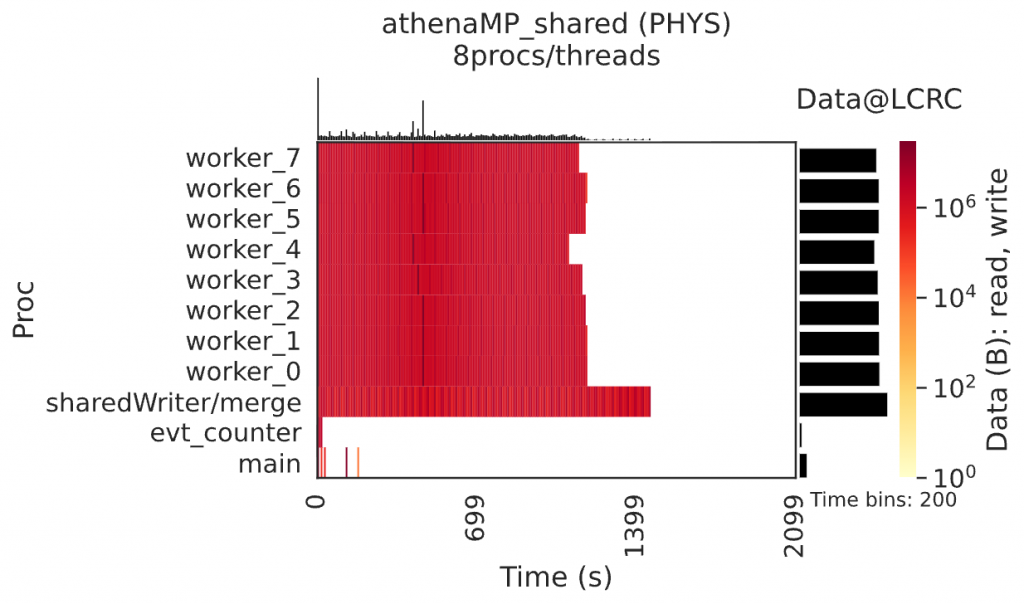
The Darshan team and collaborators in the HEP-CCE/SOP group recently completed an effort to bring Darshan into production in High Energy Physics (HEP) workflows. Out of the box, Darshan already captured a great deal of information: Darshan instruments applications transparently at runtime, capturing per-process file access statistics. Existing HEP jobs required no changes to the application code. Getting a complete and faithful picture of the entire workflow, however, took more effort. HEP frameworks parallelize by forking worker processes rather than using MPI, so Darshan had to be taught to follow those forked children and attribute their I/O correctly (Fig. 1)—along with several other runtime enhancements described below. This article describes why we pursued the work, the out-of-the-box functionality versus the required engineering efforts, and what the resulting data revealed about ATLAS I/O behavior. Read on for more details.

Background

The ATLAS experiment at the Large Hadron Collider (LHC) at CERN uses Athena as its main simulation, reconstruction, and analysis software framework and uses ROOT for its I/O and storage. Efficient data access is becoming increasingly important for HEP workflows on HPC systems. Large datasets, a greater degree of concurrency (multi-process and multithreading), and complex event formats can lead to hidden performance issues.

Before this work, ATLAS lacked lightweight I/O characterization at the process and thread level. To address this need, the following historical context outlines the adaptation of Darshan for HEP workflows.

History

The roadmap for using Darshan in HEP is built on foundational work by the HEP-CCE/SOP group to adapt Darshan for HEP use cases. Historically, Darshan was developed specifically for traditional, MPI-based parallel HPC workloads. Because typical HEP applications do not rely on MPI and instead rely heavily on multi-process (fork-based) or multi-threaded parallelism, several critical enhancements had to be made to the Darshan runtime.

As detailed in the paper Characterizing Event I/O Access Patterns in HEP Workflows Using Darshan, these enhancements included:

  1. Breaking the MPI Dependency: Adapting Darshan’s environment to initialize, track, and finalize instrumentation in completely non-MPI contexts.
  2. Handling Fork-Based Parallelism: Implementing the capability to instrument dynamically forked child processes (Fig. 1). This was a prerequisite for multi-process frameworks like AthenaMP, where worker processes are forked from a main process.
  3. Dynamic Configuration Improvements: Upgrading Darshan’s runtime configuration to allow on-the-fly modifications to memory allocations and file-filtering paths, ensuring that logs do not get flooded by transient or non-essential files.
  4. CVMFS Deployment: To ensure consistent, seamless, and transparent access across computing nodes and ATLAS environments without requiring manual compilation, Darshan was packaged and deployed directly via the CernVM File System (CVMFS).

Fig. 1: Heatmap of read and write data volume in time intervals. evt_counter, sharedWriter/merge, and worker processes are forked child processes from the main process.

With these core enhancements in place, the first step towards systematic characterization was executing baseline I/O behavior studies on key HEP experiments’ workflows. Preliminary runs analyzed different workflow stages: event generation, detector simulation, reconstruction, filtering, and physical analysis.

What the Data Revealed

The results from these initial studies exposed critical, cross-experiment I/O characteristics and established the fundamental I/O “fingerprint” used to detect meaningful software regressions.

Small Access Granularity

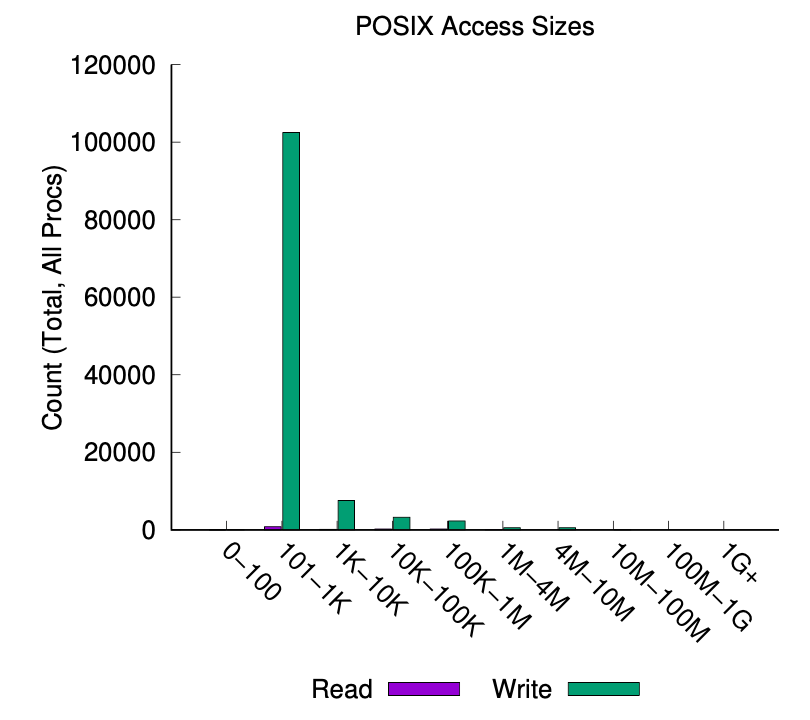
Across both ATLAS and CMS workflows, a major potential bottleneck was revealed: most execution stages (Generation, Simulation, and Reconstruction) were dominated by small, high-frequency read and write operations at the scale of *O*(1 kB) (shown in Fig. 2). This access footprint is highly mismatched with the sequential, large-block performance characteristics of HPC parallel file systems.

Fig. 2: The POSIX read/write access sizes. Top: Simulation (CMSSW), Bottom: xAOD Analysis 

Analysis Stage Throughput

The only exception was the final analysis stage (e.g., ATLAS xAOD analysis), where reads scaled up to *O*(100 kB), indicating a more efficient utilization of the storage layer’s sequential bandwidth.

Access Pattern Entropy

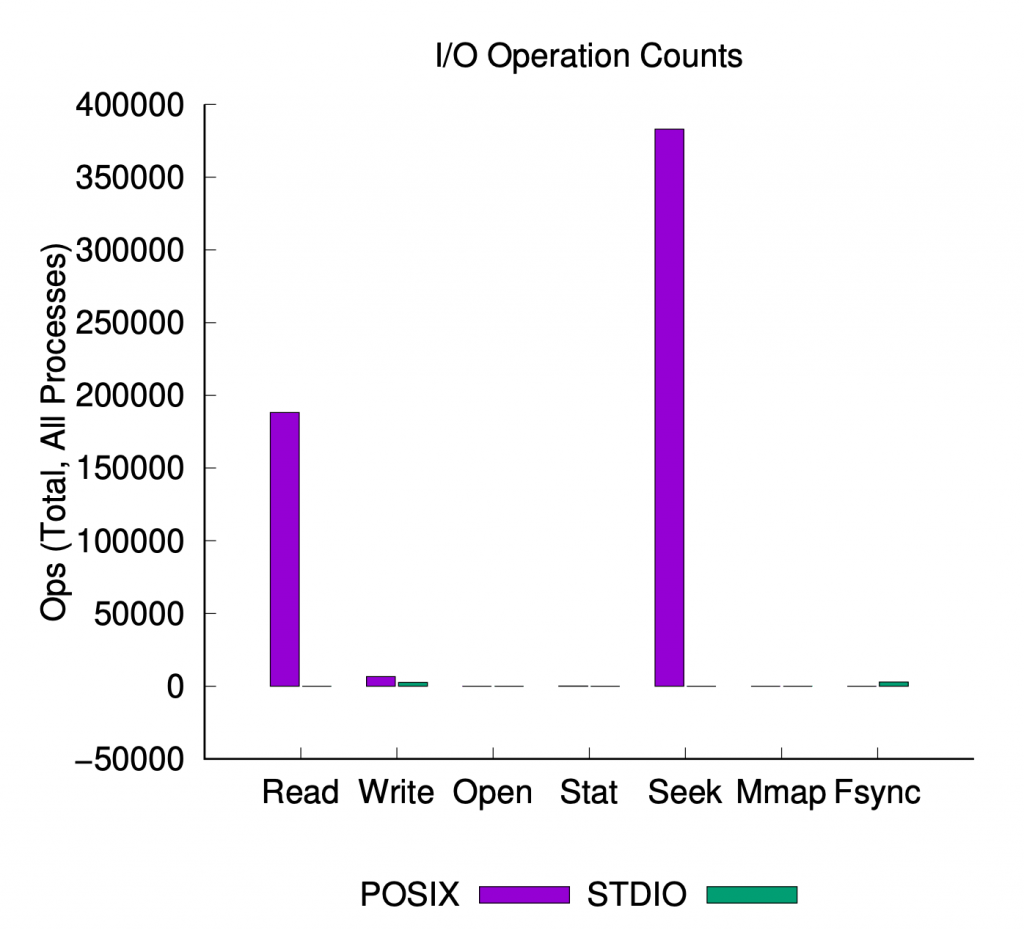
The studies revealed seek-heavy, non-contiguous access patterns during the filtering and reconstruction stages (Fig. 3), highlighting complex random access, elevated I/O wait times due to latency in random storage retrieval, and potential inefficiencies in how ROOT’s TTreeCache interacted with storage layers. Conversely, analysis workflows generally exhibit structured, sequential access, making them a reliable benchmark for detecting artifacts of non-linear regression.

Fig. 3: The number of operations (read, write, open, stat, seek, mmap, and fsync) of ATLAS simulation (Left) and CMS filtering (Right) jobs.

Clustering Dynamics

Early entropy analysis of data-mixing phases reveals high variability in cluster access, suggesting that I/O-latency can be significantly reduced by improving alignment of physical data layout with application-level data request buffers.

Concurrency and Scaling Limits

Initial studies across multiple HPC platforms also demonstrated observable correlations between access entropy, cluster granularity, and end-to-end runtime. Beyond these baselines, the study of multi-threaded execution and concurrency revealed critical scaling limitations and performance bottlenecks.

Throughput Saturation

ATLAS I/O patterns exhibit a characteristic throughput saturation at high thread counts, where the marginal performance gain from additional CPU resources is nullified by I/O-bound bottlenecks.

Fig. 4: Total bytes been reread on the input file (Left) and event throughput (Right) as a function of the total number of threads, of the Track Overlay with less compression (TO[L]) on the Improv system at Argonne Laboratory Computing Resource Center (LCRC) using Darshan.

Cache Contention and Thrashing

The primary performance bottleneck is the exponential scaling of re-operations (rereads) attributable to cluster-level cache thrashing. Under high concurrency, independent threads processing temporally adjacent events compete for limited shared block-cache buffers. This competition forces excessive cache eviction at compressed cluster boundaries, resulting in redundant, synchronized decompression cycles that degrade aggregate I/O throughput to the performance of serial access. Notably, while the absolute volume of these byte-level re-operations is stochastic, it remains stable across software releases—providing a consistent baseline for anomaly detection in production.

Fig. 5: Mapping the physical offsets from Darshan DXT records to the ROOT clusters

Data Structure Profiling

Utilizing diagnostic mapping (`darshan_reops`), researchers identified that specific high-volume data structures, such as `SiHitCollection_p3_SCT_Hits`, exhibit full-span access patterns. These structures act as “hot objects” that trigger repeated fetch/decompress cycles, identifying a clear vector for memory-to-I/O optimization.

Fig 6. Reread volume extracted from Darshan DXT records for each ROOT TBranches

Environment Dependence

Significant performance variability observed across different compute environments confirms that I/O regressions are multivariate. Effective performance monitoring requires capturing not only code-level changes but also runtime infrastructure state, underscoring the critical need for continuous, automated instrumentation.

From Ad Hoc Analysis to Continuous Monitoring

Together, these insights demonstrated Darshan’s diagnostic power and laid the groundwork for its transition from ad hoc analysis to continuous, automated performance tracking within the ATLAS SPOT infrastructure—the subject of Part 2: Integrating Darshan into SPOT for ATLAS Production Workflow Monitoring