Integrating Darshan into SPOT for ATLAS Production Workflow Monitoring

[note: I’m just posting; Orcun Yildiz and Rui Wang did all the work and contributed this writeup. Check out Part 1: Darshan for HEP: A Case Study in Characterizing ATLAS I/O Behavior while you’re here for additional context]

The Darshan team and collaborators in the HEP-CCE/SOP group recently completed an integration of Darshan into SPOT, the ATLAS experiment’s release-level performance monitoring tool. This article describes why we pursued the integration, how we carried it out, what the data revealed about ATLAS I/O behavior, and how continuous Darshan metrics are now helping detect performance regressions introduced by software changes.

Background

The Software Performance Optimization Team (SPOT) is a dedicated working group within the ATLAS Experiment at CERN. Its primary mission is to monitor, profile, and optimize the Athena software framework and computing infrastructure to handle massive data processing workloads efficiently. As an infrastructure, SPOT tracks the computational performance of Athena across software releases by running representative workflows and recording performance metrics over time, enabling release managers to detect regressions introduced by software changes.

Before we integrated Darshan, SPOT relied primarily on Prmon for job-level CPU and memory metrics and used resource-intensive tools such as VTune and Valgrind for targeted deep profiling. These tools provided high-level performance insights but lacked lightweight, continuous I/O monitoring at the process and thread level—a gap Darshan was designed to fill.

Motivation

Several factors motivated the integration of Darshan into SPOT:

  1. Demonstrated diagnostic value. The preliminary studies had revealed significant, previously unknown I/O inefficiencies, but there was no way to track them across releases.
  2. HPC deployment. ATLAS is deploying workflows on HPC platforms at NERSC, OLCF, and ALCF, where I/O performance characteristics differ markedly from traditional grid storage. Understanding how ATLAS I/O patterns interact with parallel file systems like Lustre and GPFS required continuous monitoring.
  3. Storage format transition. The ongoing transition from ROOT’s TTree format to RNTuple promised improved read performance through better data locality and compression, but the actual impact on production workflows needed to be measured empirically across the transition period.

Integration

Darshan can be deployed as a transparent interposition library (loaded via `LD_PRELOAD` or linked at build time), which makes it possible to add I/O instrumentation to existing workflows through environment configuration alone. The relevant Darshan environment variables include:

  • LD_PRELOAD pointing to the Darshan shared library
  • DARSHAN_LOG_DIR_PATH specifying where logs should be written
  • DXT_ENABLE_IO_TRACE to activate extended tracing when full operation-level detail is needed

Enabling Darshan in SPOT Workflows

To incorporate Darshan into SPOT, we modified the test execution infrastructure on the dedicated runtime environment nodes to transparently manage and inject Darshan configurations. The orchestration system automatically initializes the local runtime environment using a shared distributed file system (CVMFS) to load the unified, pre-configured experiment software stack.

During job preparation, the orchestrator sets up environment variables (DARSHAN_BASE_DIR, DARSHAN_LOGPATH, and DARSHAN_CONFIG_PATH) to load and configure the profiling tool. It dynamically injects the Darshan shared library via runtime preloading parameters directly into the ATLAS offline software (Athena) processes at runtime using command-line arguments.

The tracking runs systematically target highly I/O-intensive, multi-process data derivation and reduction tasks across a $2 \times 2$ matrix of execution configurations, typically using 16 parallel processes to process 1,000 events per process:

  1. ROOT TTree Storage format with a Shared Writer: A configuration where a dedicated writer process handles serial file writes on behalf of all workers.
  2. ROOT TTree Storage format with Shared Writer & Parallel Compression: Where worker processes handle data compression in parallel threads before passing the compressed payloads to the shared writer.
  3. ROOT RNTuple Storage format with a Shared Writer: Utilizing a modern, highly optimized columnar storage format instead of legacy formats to evaluate streaming write efficiency.
  4. ROOT RNTuple Storage format with Parallel Compression: Combining the upgraded database format with parallelized worker compression to maximize throughput.

Because the underlying multi-process framework dynamically forks worker processes at runtime, we developed a helper mapping utility that reads the operating system process IDs (PIDs) from the Darshan log headers and maps them to their logical application roles (e.g., worker process, shared writer process, or event counter process). The final diagnostic logs and execution arguments are archived in shared storage, and log details are published directly to the monitoring platform’s web area.

Post-Processing and Visualization

The post-processing and visualization pipeline uses a dedicated scripting inside the SPOT repository. Its utility manages the execution of multiple diagnostic tools to provide release managers with detailed, multi-dimensional performance insights:

  • Trend Plots: Standard scatter plot over software releases. It generates metrics such as total read/write bytes (POSIX_BYTES_READ/POSIX_BYTES_WRITTEN) for input and output datasets, general file operation counts (such as POSIX_OPENS, POSIX_FILENOS, POSIX_SEEKS, POSIX_STATS), and consecutive/sequential access metrics (POSIX_CONSEC_READS, POSIX_SEQ_READS). It also isolates metrics per logical worker role (e.g., comparing the writer process write volume to the compute worker read volume) and tracks cumulative write/read times versus bytes processed. Additionally, it visualizes memory alignment issues by querying POSIX_MEM_NOT_ALIGNED.
  • Timeline File Trace Plots (for experts only): Visualizes the full file trace over time, charting dynamic I/O operations relative to the runtime timeline.
  • Detailed I/O Trace Histograms: Using Darshan eXtended Tracing (DXT) to produce duration-versus-length distributions (e.g., comparing write_durations vs write_lengths) categorizing behavior across our matrix of configurations (comparing TTree and RNTuple formats with or without parallel compression) for specific processes.

Fig. 1: Dashboard Screenshot from the SPOT monitoring website showing performance metrics over several software releases

Ongoing Reread Integration

While basic I/O summary statistics are now fully integrated into the SPOT database and dashboards, continuous parsing and plotting of logical reread profiles are still being integrated. The aim is to move the reread diagnostic suite from independent, local post-processing scripts into SPOT’s nightly monitoring pipeline. This integration includes the standard scatter plot over software releases to track the total reread volume across serial and 8-thread jobs. Fig. 2 is an example generated locally.

Fig. 2: Total reread per nightly release for serial and 8 threads jobs 

Takeaways

The integration of Darshan into SPOT demonstrates that lightweight, continuous I/O characterization can be practically deployed within a large experiment’s existing performance monitoring infrastructure. The overhead is negligible, the logs are compact, and the resulting metrics fill a critical gap in understanding workflow performance.

This work provides a scalable methodology for detecting and diagnosing I/O bottlenecks, guiding workflow optimization, and improving resource utilization of HEP experiments as data volumes and HPC concurrency continue to grow in the exascale era and beyond.

Further details, including the SPOT monitoring dashboards and the integration code, are available at https://atlaspmb.web.cern.ch/atlaspmb/spot-mon-darshan/ and https://gitlab.cern.ch/atlaspmb/PerformanceMonitoring/-/tree/master/perf .
Darshan for HEP: A Case Study in Characterizing ATLAS I/O Behavior

[note: I just posted the content: Orcun Yildiz https://www.anl.gov/profile/orcun-yildiz contributed this article describing the work he did with Rui Wang https://www.anl.gov/profile/rui-wang ]

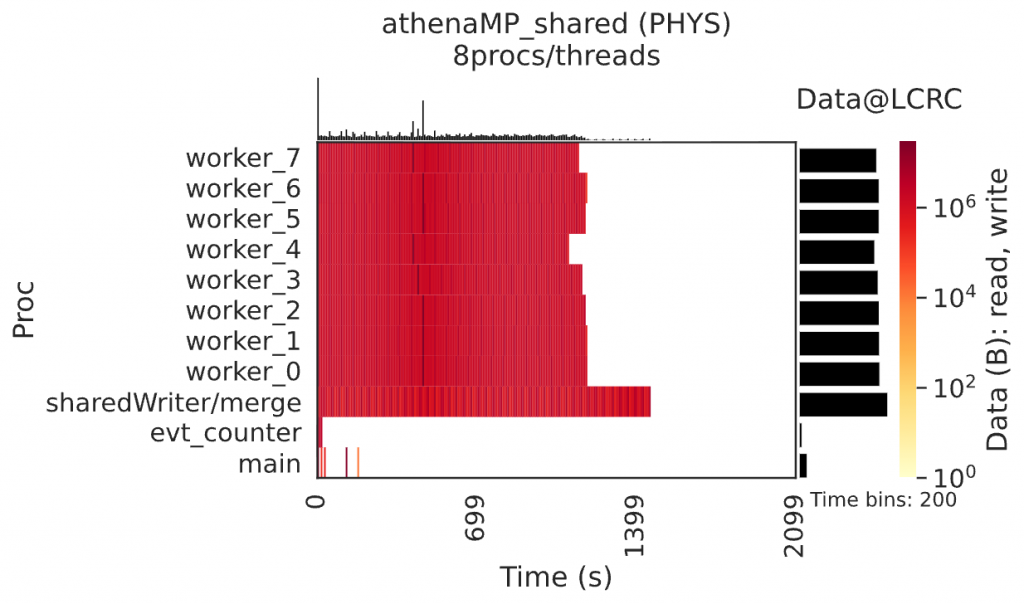
The Darshan team and collaborators in the HEP-CCE/SOP group recently completed an effort to bring Darshan into production in High Energy Physics (HEP) workflows. Out of the box, Darshan already captured a great deal of information: Darshan instruments applications transparently at runtime, capturing per-process file access statistics. Existing HEP jobs required no changes to the application code. Getting a complete and faithful picture of the entire workflow, however, took more effort. HEP frameworks parallelize by forking worker processes rather than using MPI, so Darshan had to be taught to follow those forked children and attribute their I/O correctly (Fig. 1)—along with several other runtime enhancements described below. This article describes why we pursued the work, the out-of-the-box functionality versus the required engineering efforts, and what the resulting data revealed about ATLAS I/O behavior. Read on for more details.

Background

The ATLAS experiment at the Large Hadron Collider (LHC) at CERN uses Athena as its main simulation, reconstruction, and analysis software framework and uses ROOT for its I/O and storage. Efficient data access is becoming increasingly important for HEP workflows on HPC systems. Large datasets, a greater degree of concurrency (multi-process and multithreading), and complex event formats can lead to hidden performance issues.

Before this work, ATLAS lacked lightweight I/O characterization at the process and thread level. To address this need, the following historical context outlines the adaptation of Darshan for HEP workflows.

History

The roadmap for using Darshan in HEP is built on foundational work by the HEP-CCE/SOP group to adapt Darshan for HEP use cases. Historically, Darshan was developed specifically for traditional, MPI-based parallel HPC workloads. Because typical HEP applications do not rely on MPI and instead rely heavily on multi-process (fork-based) or multi-threaded parallelism, several critical enhancements had to be made to the Darshan runtime.

As detailed in the paper Characterizing Event I/O Access Patterns in HEP Workflows Using Darshan, these enhancements included:

  1. Breaking the MPI Dependency: Adapting Darshan’s environment to initialize, track, and finalize instrumentation in completely non-MPI contexts.
  2. Handling Fork-Based Parallelism: Implementing the capability to instrument dynamically forked child processes (Fig. 1). This was a prerequisite for multi-process frameworks like AthenaMP, where worker processes are forked from a main process.
  3. Dynamic Configuration Improvements: Upgrading Darshan’s runtime configuration to allow on-the-fly modifications to memory allocations and file-filtering paths, ensuring that logs do not get flooded by transient or non-essential files.
  4. CVMFS Deployment: To ensure consistent, seamless, and transparent access across computing nodes and ATLAS environments without requiring manual compilation, Darshan was packaged and deployed directly via the CernVM File System (CVMFS).

Fig. 1: Heatmap of read and write data volume in time intervals. evt_counter, sharedWriter/merge, and worker processes are forked child processes from the main process.

With these core enhancements in place, the first step towards systematic characterization was executing baseline I/O behavior studies on key HEP experiments’ workflows. Preliminary runs analyzed different workflow stages: event generation, detector simulation, reconstruction, filtering, and physical analysis.

What the Data Revealed

The results from these initial studies exposed critical, cross-experiment I/O characteristics and established the fundamental I/O “fingerprint” used to detect meaningful software regressions.

Small Access Granularity

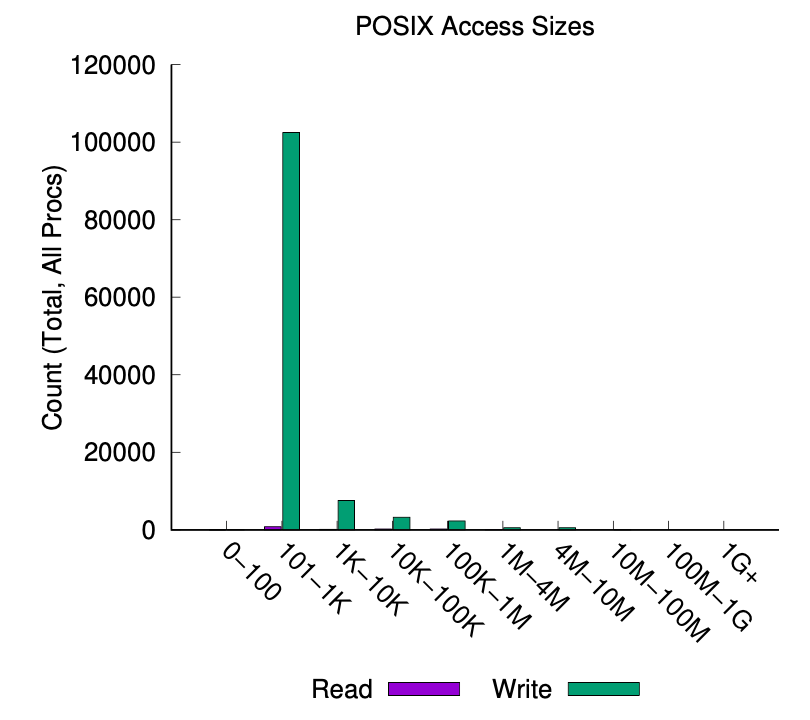
Across both ATLAS and CMS workflows, a major potential bottleneck was revealed: most execution stages (Generation, Simulation, and Reconstruction) were dominated by small, high-frequency read and write operations at the scale of *O*(1 kB) (shown in Fig. 2). This access footprint is highly mismatched with the sequential, large-block performance characteristics of HPC parallel file systems.

Fig. 2: The POSIX read/write access sizes. Top: Simulation (CMSSW), Bottom: xAOD Analysis 

Analysis Stage Throughput

The only exception was the final analysis stage (e.g., ATLAS xAOD analysis), where reads scaled up to *O*(100 kB), indicating a more efficient utilization of the storage layer’s sequential bandwidth.

Access Pattern Entropy

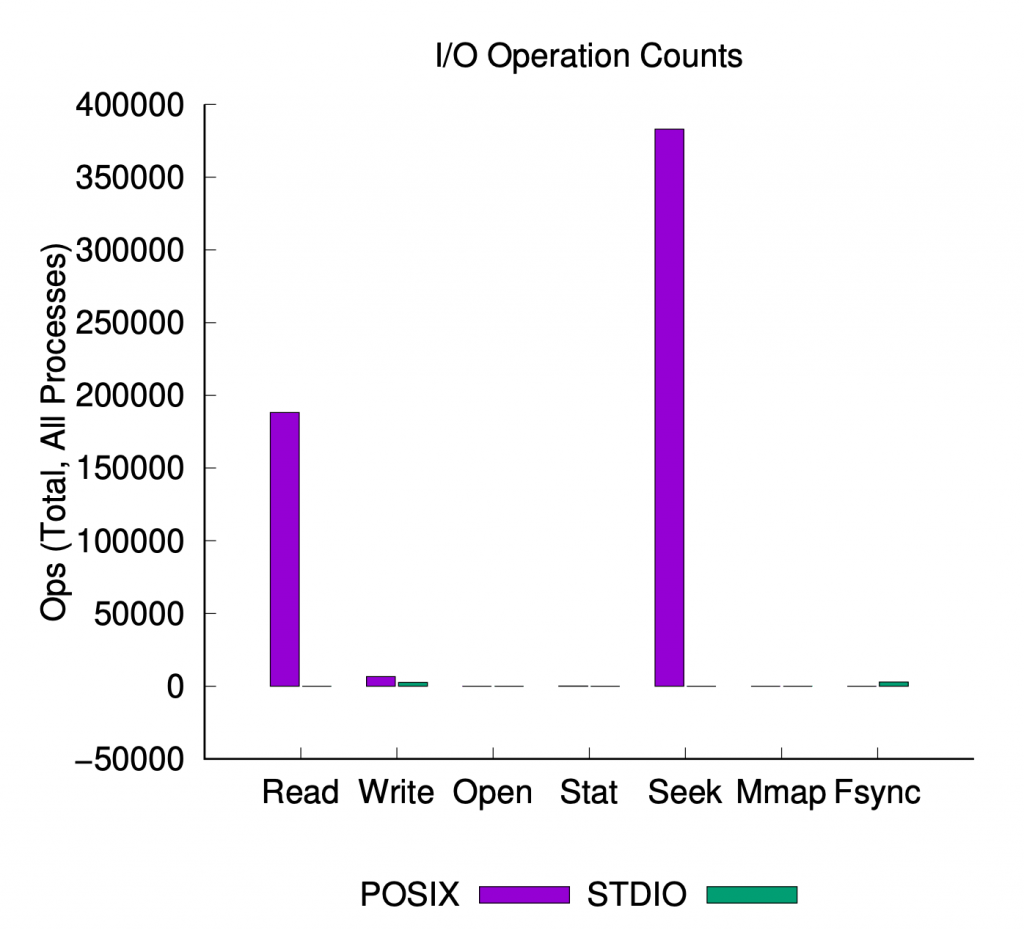
The studies revealed seek-heavy, non-contiguous access patterns during the filtering and reconstruction stages (Fig. 3), highlighting complex random access, elevated I/O wait times due to latency in random storage retrieval, and potential inefficiencies in how ROOT’s TTreeCache interacted with storage layers. Conversely, analysis workflows generally exhibit structured, sequential access, making them a reliable benchmark for detecting artifacts of non-linear regression.

Fig. 3: The number of operations (read, write, open, stat, seek, mmap, and fsync) of ATLAS simulation (Left) and CMS filtering (Right) jobs.

Clustering Dynamics

Early entropy analysis of data-mixing phases reveals high variability in cluster access, suggesting that I/O-latency can be significantly reduced by improving alignment of physical data layout with application-level data request buffers.

Concurrency and Scaling Limits

Initial studies across multiple HPC platforms also demonstrated observable correlations between access entropy, cluster granularity, and end-to-end runtime. Beyond these baselines, the study of multi-threaded execution and concurrency revealed critical scaling limitations and performance bottlenecks.

Throughput Saturation

ATLAS I/O patterns exhibit a characteristic throughput saturation at high thread counts, where the marginal performance gain from additional CPU resources is nullified by I/O-bound bottlenecks.

Fig. 4: Total bytes been reread on the input file (Left) and event throughput (Right) as a function of the total number of threads, of the Track Overlay with less compression (TO[L]) on the Improv system at Argonne Laboratory Computing Resource Center (LCRC) using Darshan.

Cache Contention and Thrashing

The primary performance bottleneck is the exponential scaling of re-operations (rereads) attributable to cluster-level cache thrashing. Under high concurrency, independent threads processing temporally adjacent events compete for limited shared block-cache buffers. This competition forces excessive cache eviction at compressed cluster boundaries, resulting in redundant, synchronized decompression cycles that degrade aggregate I/O throughput to the performance of serial access. Notably, while the absolute volume of these byte-level re-operations is stochastic, it remains stable across software releases—providing a consistent baseline for anomaly detection in production.

Fig. 5: Mapping the physical offsets from Darshan DXT records to the ROOT clusters

Data Structure Profiling

Utilizing diagnostic mapping (`darshan_reops`), researchers identified that specific high-volume data structures, such as `SiHitCollection_p3_SCT_Hits`, exhibit full-span access patterns. These structures act as “hot objects” that trigger repeated fetch/decompress cycles, identifying a clear vector for memory-to-I/O optimization.

Fig 6. Reread volume extracted from Darshan DXT records for each ROOT TBranches

Environment Dependence

Significant performance variability observed across different compute environments confirms that I/O regressions are multivariate. Effective performance monitoring requires capturing not only code-level changes but also runtime infrastructure state, underscoring the critical need for continuous, automated instrumentation.

From Ad Hoc Analysis to Continuous Monitoring

Together, these insights demonstrated Darshan’s diagnostic power and laid the groundwork for its transition from ad hoc analysis to continuous, automated performance tracking within the ATLAS SPOT infrastructure—the subject of Part 2: Integrating Darshan into SPOT for ATLAS Production Workflow Monitoring

Darshan 3.5.0 release is now available

Darshan version 3.5.0 is now officially available for download. Noticeable changes from the previous release are summarized below.

  • Starting from 3.5.0, Darshan release numbers will use the form of MAJOR.MINOR.PATCH, conforming with the Semantic Versioning standard.
  • All future software releases will be available from Darshan’s Github repository.
  • Darshan’s Python package 3.5.0 is available for install from PyPI.
  • Darshan’s documentation has moved to readthedocs.io.
  • Support large-count MPI-IO APIs introduced in MPI 4.0.
  • Change the default mode of mmap I/O data to log file to enable.
  • Fixed an issue of capturing I/O activities of NumPy programs.
  • Adds a command-line option –version to print Darshan version for all utility tools.
  • Bug fixes to handling of DAOS metrics in PyDarshan and the job summary command line tool.
  • Enhancements to the job_stats and file_stats command line tools:
    • Adds new performance metrics of I/O bandwidth by slowest, I/O time by slowest, and total bytes.
    • Adds job and file levels of statistics for DAOS and DFS modules.

Please report any questions, issues, or concerns with this release on our Slack instance, using the Darshan-users mailing list, or by opening an issue on our GitHub repo.

A Case Study in Debugging the OpenMPI MPI-IO Implementation with Darshan

The Darshan team recently encountered a sequence of bugs that produced corrupt log files when Darshan was linked against OpenMPI. This article provides some broader background, how we used Darshan itself to diagnose the problem, and what we learned from the experience.

Background

Darshan is an I/O characterization tool that produces concise summaries of how applications use a variety of different I/O interfaces. One of the interfaces that it instruments is MPI-IO (the part of the MPI specification that provides an abstraction for accessing files in parallel). MPI-IO is unique among the interfaces that Darshan instruments, however, because Darshan is itself also a user of MPI-IO. When an application terminates, Darshan writes the final compressed version of its instrumentation to a log file using MPI-IO.

MPI-IO is crucial to Darshan’s efficiency and portability because it has the discretion to reshape I/O traffic into more efficient access patterns for whatever platform you are running your code on. For example, data from collective writes is often aggregated into intermediate buffers that can satisfy the optimal concurrency, access size, and lock boundaries of an underlying storage system. This optimization is called “collective buffering”. The Darshan code is greatly simplified because it does not have to detect the underlying file system parameters or implement this optimization itself; it simply describes the data to be written, and MPI-IO does the rest.

Darshan also uses hints to further optimize how collective buffering is performed in Darshan’s specific use case. MPI-IO must optimize for the general case, but Darshan log files have specific properties: they are usually very small (far less than a megabyte), and they usually contain small amounts of data contributed by every process. For most file systems, this means that the time to write a Darshan log at scale is dominated by the cost of concurrent open() traffic, not by the cost of the actual data transfer. We therefore set hints when the log file is opened to give MPI-IO some clues. Specifically, Darshan sets cb_nodes=4 to suggest that no more than 4 processes are needed to aggregate data, and romio_no_indep_rw=true to indicate that most Darshan ranks will not perform independent I/O operations. Taken together, an MPI implementation can use this information to activate a “deferred open” mode, in which at most 4 processes open the Darshan log file and write data on behalf of all of the other processes. This greatly reduces the cost of writing small log files onto a parallel file system at scale.

Darshan was originally developed at Argonne National Laboratory using MPI implementations derived from MPICH, which internally uses an MPI-IO implementation called “ROMIO.” Darshan also works equally well with MPI implementations derived from OpenMPI, which internally uses an MPI-IO implementation called “OMPIO”. Different MPI-IO implementations do not support the same hints, but there is no harm in attempting to set them for any MPI implementation. They are advisory parameters that implementations are not obligated to honor, and they do not impact data correctness.

The problem

Over time, the Darshan team has occasionally received bug reports (via Slack, mailing list, or GitHub) of corrupted Darshan logs. Darshan does not produce any runtime error messages in these cases, but subsequent analysis tools are unable to parse the log files. The most frustrating part of this problem has been our inability to independently reproduce it. The reports all involved OpenMPI, but that didn’t really tell us anything (or even indicate that OpenMPI had anything to do with the problem; OpenMPI is broadly used, and most of Darshan log files produced with it look perfectly fine). The applications were different, the scales were different, the OpenMPI versions were different, and our attempts to locally reproduce the problem always failed.

The breakthrough

Wei-keng Liao of Northwestern University (a recent addition to the core Darshan development team after a long history of contributions) recently implemented expanded coverage of the MPI-IO API to account for large integer types in https://github.com/darshan-hpc/darshan/pull/1060. As part of this work, Wei-keng added GitHub CI tests to exercise the instrumentation and validate corresponding Darshan counters.

Although it had nothing to do with the feature being implemented, Wei-keng happened to find a permutation that reliably caused Darshan log file corruption every time we executed the GitHub CI action! The problem (as in previous reports) occurred with OpenMPI, but this time within a CI environment with 4 processes executing on a single virtual node.

We weren’t quite done yet, because despite having the code and configuration clearly documented, the same problem still didn’t necessarily occur on other (non-GitHub) environments.

Isolating the problem

Wei-keng looked at the precise offsets and sizes being written by Darshan and re-created these in a standalone MPI program (without the Darshan library) that self-validated the data that it wrote using a predetermined pattern so that we could more easily try different permutations. We used strace to observe the system calls that it produced, and were surprised to see that it generated read/modify/write operations at the file system level. This meant that OpenMPI was performing “data sieving”. Data sieving is another popular MPI-IO optimization; if you need to write multiple discontiguous regions in a file, sometimes it is faster to read in the full span, modify the regions of interest, and then write the full span out rather than issues many small write operations. However, we confirmed that the Darshan log file was densely populated (no gaps) and was written with non-overlapping writes. There was no apparent reason for data sieving to be activated.

With this knowledge in hand, we identified that the problem only occurs in OpenMPI 5.0.5 or earlier, and that it was likely resolved by the bug fix to the ompio file locking strategy in https://github.com/open-mpi/ompi/pull/12759. Our CI action happened to use an old enough version of OpenMPI and issued a particular combination of writes operations that triggered the bug.

This still left us with two issues: a) Why was OpenMPI performing data sieving in the first place? (regardless of the locking strategy) and b) What could we do in Darshan to mitigate the problem? Darshan must operate correctly even on production systems that have deployed older versions of OpenMPI.

OpenMPI issues

Using the information we learned above, we further simplified the reproducer, used Darshan to observe the access patterns it generated, and opened an issue on the OpenMPI GitHub repository describing some precise scenarios in which adversarial access patterns are generated (https://github.com/open-mpi/ompi/issues/13376). We do not have sufficient expertise in the code base to attempt a fix, but it is clear that under certain configurations, ompio distributes data to aggregators in a way that results in interleaved discontiguous regions at some ranks. This, in conjunction with an automatic data sieving optimization, forces ompio to write data using conflicting write operations that are serialized with advisory locks. While recent versions of OpenMPI have an improved file locking algorithm that avoids data corruption in this scenario, it is still not an efficient access pattern.

While exploring potential mitigations to use in Darshan, we considered that maybe we should simply turn off collective buffering (via another MPI_Info hint) in some situations to avoid the problem. While checking the impact of this potential mitigation, we discovered a second problem, reported in https://github.com/open-mpi/ompi/issues/13377, in that the logic for the collective_buffering= hint appears to be inverted. If that hint is provided, then it must be set to false to enable collective buffering. This counterintuitive behavior makes usage of this hint particularly dangerous, because the semantics could be corrected in the future. We had to continue looking for a different mitigation.

Darshan mitigation

In addition to alerting the OpenMPI developers of the ompio problems described above, we did eventually identify a Darshan mitigation that allows Darshan to work correctly with any OpenMPI version. If we detect that OpenMPI is present, then we simply set our default hints to cb_nodes=1 rather than cb_nodes=4 (the cb_nodes hint is honored by both MPICH/ROMIO and OpenMPI/OMPIO). When we set it to 1, OpenMPI will still perform collective buffering, but the data is buffered at a single process so that there is no risk of interleaved/overlapping/conflicting write operations.

This mitigation will be included in the next Darshan minor release (probably Darshan 3.5.0).

Takeaways

Although the OpenMPI bugs we observed were originally triggered by Darshan’s internal logging code, we found Darshan itself to be very helpful in understanding the nature of the bugs. In particular, we used Darshan’s optional DXT tracing mode, which can be activated in any Darshan build by setting an environment variable, to compare the access patterns expressed at the MPI-IO level to the access patterns enacted at the POSIX level of the HPC I/O stack.

We also learned not to take MPI-IO behavior for granted. The API and semantics are defined by the MPI specification, but implementors have the discretion to implement I/O transformations how they see fit. In our case, the Darshan log write access pattern happened to produce an adversarial access pattern in OMPIO that requires special handling to mitigate.

Finally, continuous integration proved itself to be an invaluable tool for supporting complex system software. We would not have been able to isolate this problem (much less had any clue what the underlying causes were) without a pull request that introduced a thorough CI test for an entirely unrelated capability. Darshan is a mature software project that has gained CI capability in a piecemeal fashion; this case study encourages us to pursue a more comprehensive CI strategy in the future.

Continuously updated Darshan log repository now available from the ALCF Polaris system

The Darshan team is pleased to announce the public availability of the ALCF Polaris Darshan Log Repository. This is an anonymized, continuously updated collection of all production logs captured on the 560 node Polaris system at the ALCF. We hope that continuous publication of this data helps the computer science community to better understand current production workloads.

As of this writing (June 5, 2025) the repository contains over 1.2 million log files and is growing at an average rate of roughly 3,000 logs per day, though coverage rates and job workloads vary considerably from day to day.

See the Zenodo report for more information about how to download, analyze, and acknowledge use of the data in publications.

See the CUG 2025 presentation (corresponding paper pending proceedings publication) for more information about how the repository was created, examples of analyses that can be performed on it, and links to tools that can be used to reproduce those examples.

Darshan 3.4.7 release is now available

Darshan version 3.4.7 is now officially available for download HERE. This point release most notably includes new modules enabling detailed instrumentation of DAOS storage systems (e.g., on ALCF Aurora):

  • There are 2 new modules that instrument the DAOS file system interface (DFS) and native object interfaces (DAOS).
  • Darshan’s heatmap module also now supports capture of I/O activity across both of these new DAOS modules.

We have also released PyDarshan 3.4.7.0 on PyPI, which includes the following new capabilities:

  • New PyDarshan CLI tools for extracting statistics from one or more input log files:
    • job_stats: Overall job-level I/O statistics for each input Darshan log
    • file_stats: Overall file-level I/O statistics for application files accessed across all input Darshan logs
    • Each tool offers command line options to control how jobs/files are sorted, statistics output format (CSV or Rich-style printing), Darshan module to analyze, etc.
  • Support for reading DAOS module data, as well as integrations of DAOS data into PyDarshan summary reports.
  • Support for PyDarshan ReportObject name filtering, enabling users to provide record name patterns to match when reading data from Darshan logs.
    • Available via filter_patterns and filter_mode arguments to various ReportObject routines:
      • filter_patterns: list of regexes to match
      • filter_mode: “exclude” or “include” records matching provided regexes

Documentation for Darshan and PyDarshan is available HERE.

Please report any questions, issues, or concerns with this release on our Slack instance, using the Darshan-users mailing list, or by opening an issue on our GitHub.

Using Darshan with non-MPI applications (e.g., AI/ML frameworks)

Darshan is an application-level I/O characterization tool that has been traditionally used in the HPC community for understanding file access characteristics of MPI applications. However, in recent years Darshan has been redesigned to relax it’s dependence on MPI so that it can support instrumentation of other programming models and runtime environments that are gaining traction in HPC. In this article, we will cover some of these new improvements to Darshan and cover best practices for general instrumentation of applications that don’t use MPI, ranging from serial applications to Python multiprocessing frameworks (e.g., PyTorch, Dask, etc.).

Darshan enhancements for non-MPI usage

Support for non-MPI instrumentation in Darshan began starting with our 3.2.0 release (thanks in large part to contributions from Glenn Lockwood, Microsoft). These changes revolved around adopting new mechanisms for bootstrapping the Darshan library when a process launches and shutting down the Darshan library when a process terminates. Traditionally, this was handled by intercepting MPI_Init/MPI_Finalize routines that MPI applications conveniently call at application startup/shutdown. To support more general mechanisms for this, Darshan adopted the usage of GCC constructor/destructor attributes1 for its startup/shutdown routines. 

Beyond this initial redesign, additional changes have recently been made to the Darshan library based on our experiences in instrumenting various non-MPI applications (e.g., workflow systems, Python multiprocessing packages). These changes are outlined below.

  1. Processes that call fork()
    • Problem: Child processes from fork() calls inherit their parent’s memory, including Darshan library state. This can lead to duplicate accounting of the parent’s I/O statistics in the child process’s log.
    • Solution: Use pthread_atfork() handlers to get hooks into child process initialization, allowing Darshan library state to be reinitialized. Initial support provided in Darshan’s 3.3.1 release.
  2. Processes that terminate abruptly using _exit() calls
    • Problem: Some multiprocessing frameworks use fork-join models that call “immediate” exit routines (i.e., _exit()). For example, we have observed this behavior in some configurations of Python’s multiprocessing package, which is commonly used by PyTorch and other frameworks. This immediate exit routine is generally used to prevent child processes from interfering with resources that may still be used by the parent process (e.g., by flushing buffers, calling atexit handlers, etc.). But, immediate exit also bypasses the Darshan library’s destructor routine which finalizes Darshan and writes out its log file.
    • Solution: Darshan has been updated to intercept calls to _exit() in the same way it would traditionally intercept MPI_Finalize() for MPI applications. This change enables Darshan to cleanly shutdown before the process starts its immediate termination. Initial support provided in Darshan’s 3.4.5 release.
  3. Processes that terminate abruptly via kill signals
    • Problem: Some multiprocessing frameworks use fork-join models that simply terminate child processes via kill signals. We have also observed this behavior in some configurations of Python’s multiprocessing package. Termination via kill signals (i.e., SIGTERM) similarly bypasses Darshan’s typical shutdown procedure. Unfortunately, the only mechanism to interpose Darshan’s shutdown before this signal is using a signal handler, but the Darshan shutdown procedure is not async-signal-safe (i.e., it cannot be safely called in a signal handler). 
    • Solution: Darshan actually has a longstanding optional feature to store its log data in memory-mapped files as the application executes, instead of storing this data on the heap and writing it out to a log file at process termination time. This feature was originally envisioned to support cases where MPI applications don’t call MPI_Finalize() (e.g., because they hit their wall-time limit on a batch scheduled system), but it actually helps preserve Darshan data in cases like this where processes are abruptly terminated. Initial support provided in Darshan’s 3.1.0 release.

Best practices for non-MPI instrumentation in Darshan

  1. To take advantage of all of the extensions detailed above, use a Darshan release version >= 3.4.5.
  2. When building darshan-runtime, enable the mmap logs feature to help protect against processes that abruptly terminate via kill signals.
    • For Spack builds, use the +mmap_logs variant.
    • For darshan-runtime source builds, use the --enable-mmap-logs configure option.
  3. To interpose the Darshan library, you have two options2:
    • Set LD_PRELOAD=/path/to/darshan/lib/libdarshan.so to ensure Darshan instrumentation wrappers can intercept application I/O routines.
      • This option is necessary for Python applications, as there is no way to directly link the Darshan library into the Python binary.
    • Directly link the Darshan library on the command line using -ldarshan when building your application.
      • Darshan should precede all other libraries to ensure it’s first in link ordering, otherwise it may not intercept application I/O calls.
  4. Enable Darshan’s non-MPI mode by setting DARSHAN_ENABLE_NONMPI=1 in your environment.
    • non-MPI mode requires this variable to be explicitly set so Darshan doesn’t inadvertently generate log files for extraneous commands (e.g., ls, git, etc.).
    • Instrumenting specific applications can then be accomplished by simply running  a command like: DARSHAN_ENABLE_NONMPI=1 <binary> <cmd_args>
  5. If necessary, consider using Darshan library configuration files to increase Darshan’s default memory/record limits, to enable/disable certain Darshan modules, or to limit Darshan instrumentation to files matching some pattern (e.g., a mount point prefix, a file extension suffix).
    • This is particularly helpful for Python applications, which tend to access tons of shared libraries (.so), Python compiled code (.pyc), etc., which can quickly exhaust Darshan’s record memory.
    • If using traditional Darshan tools like darshan-parser or the PyDarshan job summary tool, an error message is reported if Darshan ran out of memory, in which case this configuration file is needed to help ensure Darshan allocates and uses a sufficient amount of memory.
    • See the next section for example usage of config files.
  6. After your Darshan instrumented application terminates, check the /tmp directory (the default output location for Darshan mmap log files) for any Darshan logs generated by processes that terminate abruptly.
    • We recommend copying these log files somewhere permanent and compressing them in Darshan’s standard compressed format to save space using the darshan-convert utility, e.g.:
      • darshan-convert /tmp/logfile.darshan /path/to/darshan/log/dir/logfile.darshan
    • Processes that terminate normally do not output logs to /tmp and instead output the logs in standard compressed format in your standard Darshan log output directory. 

Example Darshan runtime library configuration

Darshan runtime library configuration options can be expressed using a configuration file that can be passed to Darshan at runtime by setting the following environment variable: DARSHAN_CONFIG_PATH=/path/to/darshan.conf

An example configuration file is given below that demonstrates the types of settings you can control within the Darshan runtime library. Not all settings may be needed, depending on your workload and your use case, and often times some experimentation is needed to determine appropriate settings. This is a necessary trade-off as Darshan is designed for low-overhead, comprehensive instrumentation of applications — increasing default memory limits or restricting scope of instrumentation are not our default operational modes.

# allocate 4096 file records for POSIX and MPI-IO modules
# (Darshan only allocates 1024 per-module by default)
# NOTE: MODMEM setting may need to be bumped independent of this setting,
#             as it does not force Darshan to use a larger instrumentation buffer
MAX_RECORDS     4096      POSIX,MPI-IO

# in this case, we want all modules to ignore record names
# with a ".pyc" or a ".so" file extension
# NOTE: multiple regex patterns can be provided at once, separated by commas
# NOTE: the '*' specifier can be used to apply settings for all modules
NAME_EXCLUDE    \.pyc$,\.so$          *

# bump up Darshan's default record memory usage to 8 MiB
MODMEM  8

# bump up Darshan's default name record memory usage to 2 MiB
# NOTE: Darshan uses separate memory for storing record names (i..e, file names)
#              that can also be exhausted, so this must be bumped independently of
#              MODMEM in the case where lots of file name data is captured
NAMEMEM 2

# default modules not of interest can be disabled like this
MOD_DISABLE     STDIO

# non-default modules like DXT tracing modules can be enabled like this
MOD_ENABLE      DXT_POSIX,DXT_MPIIO

More extensive details on Darshan configuration file format is provided HERE.

Future work

To help with the analysis of Darshan log data from multiprocessing frameworks that generate numerous Darshan logs, we are working to extend Darshan analysis tools to support aggregation of this data into single summary outputs. This will enable more comprehensive analysis of these frameworks, similar to how Darshan provides summaries of all processes in MPI applications in a single, concise summary. We expect our next release (3.4.7) to have some capabilities for analyzing data from multiple logs. Stay tuned for updates on this ongoing work.

  1.  https://gcc.gnu.org/onlinedocs/gcc/Common-Function-Attributes.html ↩︎
  2.  Darshan’s non-MPI mode only works for dynamically-linked executables and requires a compiler that supports GCC constructor/destructor attributes (most do). ↩︎

Darshan 3.4.6 release is now available

Darshan version 3.4.6 is now officially available for download HERE. This point release includes a couple of important new capabilities and bug fixes:

  • Added enhancements to Darshan’s Lustre instrumentation module to capture more extensive details on Lustre striping configurations
    • Lustre file records now composed of potentially multiple component counter sets (e.g., LUSTRE_COMP1_*, LUSTRE_COMP2_*, etc.)
    • Allows full characterization of newer Lustre striping features, including progressive file layouts , data-on-metadata, file-level redundancy, and self-extending layouts
  • Fixed bugs in Darshan’s log compression/decompression routines that are triggered when using the zlib-ng software package, a new implementation of the zlib compression library
    • darshan-runtime bug fix corrects problematic log compression strategy
    • darshan-util bug fix corrects logs already generated with this issue
  • Fixed bug leading to hangs when parsing improperly formatted Darshan runtime library configuration settings

We have also released PyDarshan 3.4.6.0 on PyPI, though this is just to track the 3.4.6 darshan-util library. There are no modifications to PyDarshan functionality.

Documentation for Darshan and PyDarshan is available HERE.

Please report any questions, issues, or concerns with this release on our Slack instance, using the Darshan-users mailing list, or by opening an issue on our GitHub.

Darshan 3.4.5 now available

Darshan version 3.4.5 is now officially available for download HERE. This point release includes a couple of important new capabilities and bug fixes:

  • Added capability for Darshan’s runtime library to properly shutdown in non-MPI applications that call _exit() directly
    • This behavior has been commonly observed in the Python multiprocessing package, which has traditionally prevented Darshan from properly instrumenting applications that use it (e.g., the PyTorch DataLoader)
  • Added optional integration with the LDMS data/metrics collection system, allowing realtime analysis of Darshan instrumented I/O operations
  • Fixed bug preventing instrumentation of fscanf() calls on some systems
  • Fixed bug in HDF5 module causing any call to HDF5’s H5Pset_fapl_mpio() routine to fail 

We have also released PyDarshan 3.4.5.0 on PyPI, though this is just to track the 3.4.5 darshan-util library. There are no modifications to PyDarshan functionality.

Documentation for Darshan and PyDarshan is available HERE.

Please report any questions, issues, or concerns with this release using the Darshan-users mailing list or by opening an issue on our GitHub.

Darshan 3.4.4 now available

Darshan version 3.4.4 is now officially available for download HERE. This point release includes a few minor bug fixes:

  • Fixed bug leading to inconsistent heatmap record shapes when Darshan shared file reductions are disabled
    • Also added a darshan-util library fix to resolve this inconsistency on already impacted logs (any generated with 3.4.0+ versions of Darshan)
  • Added workaround for potential undefined symbol errors for ‘H5FD_mpio_init’ when LD_PRELOADing an HDF5-enabled runtime library
    • Bug triggered by 1.13+ versions of HDF5

We have also released PyDarshan 3.4.4.0 on PyPI, though this is just to track the 3.4.4 darshan-util library. There are no modifications to PyDarshan functionality.

Documentation for Darshan and PyDarshan is available HERE.

Please report any questions, issues, or concerns with this release using the darshan-users mailing list or by opening an issue on our GitHub.