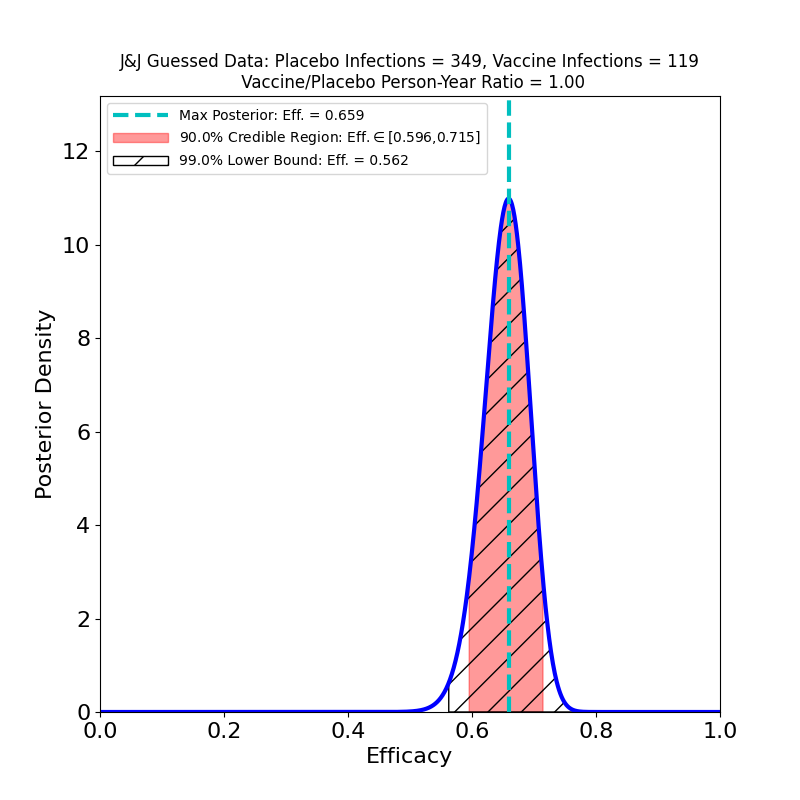
The “data” for these plots is obtained from a Johnson & Johnson corporate press release issued on 29 January 2021. The release is actually not that informative — among other things, it doesn’t state explicitly the number of vaccine-group and placebo-group infections in the clinical trial, or for any of its subgroups. We have to wait either for a briefing document submitted to an FDA EUA committe, or a published journal article.
Update (5 Feb. 2021): The FDA has announced that the EUA committee will meet on 26 February 2021, and that background materials will be made available to the public “no later than two business days prior to the meeting”. So it should be possible to update this post with real data on or about 24 February.
Update (25 Feb. 2021): The EUA briefing is now available, so this post is not the best place to read about this vaccine. See this post instead.
On the other hand, it is possible to guess one pair of numbers from the press release, even if they are not stated explicitly. The release states that 468 symptomatic cases of COVID-19 were observed overall, and that the overall efficacy inferred from this is 66%. From this, with a very little algebra, we can surmise that the number of vaccine cases was 119 and the number of placebo cases was 349, assuming the placebo and vaccine groups were the same size.
We therefore tentatively have this analysis:

The peak is at 66% (by construction, since this is how I guessed the data). The vaccine looks quite effective — not as spectacular as some of the other vaccine topline results, but certainly enough to be effective in a vaccination campaign. The trial was conducted over North and South America, as well as in South Africa, so it is quite likely that this analysis mingles different efficacies due to the emergence of different variants in different regions — compare the results reported by Novavax for their vaccine.