I began writing this series of posts as a way of systematizing a number of ideas—some of them mere discomforts—that I’ve been accumulating as I’ve learned to to do technical/statistical/data-driven work in COVID-19 epidemiology over the course of the past year or so. I don’t exactly know what to do with these ideas: not being a trained life scientist, I don’t have a great track record at writing life science papers, and in any event I’m not certain that the things that I’ve discussed in the past few posts could be fit comfortably in a “real” scientific paper. There isn’t a lot of data in what I’ve discussed, for one thing (which makes it a weird thing for a “data scientist” to be trafficking in!). On the other hand, I do think that I have seen a few things that have value, and uncovered some unexamined assumptions that really need to be held up to sunlight. So the best I can think to do for now is blog them, and hopefully get the parts of the ideas that turn out not to be wrong into scientific discussions.
I’ve pretty much emptied the sack at this point, so I’m not planning to keep on writing more of these, unless I notice anything else. What I’d like to do today is draw up a coherent summary of where we stand with respect to breakthroughs, vaccines, Omicron, and the state of epidemic surveillance, drawing on the last four posts.
Why Do We Need A “False Breakthrough” Type, Anyway?
In the first post of this series, I introduced a typology of breakthrough infections that helped me organize the rest of this discussion. If you review that typology now (go ahead, I’ll wait) there is something about it that ought to strike you as a bit weird. Why on Earth should there even exist a Type 3a, “False Breakthrough Infection” category? How could it have come about that we are arguing about whether or not an infection is, in fact, an infection?
There is actually something unusual about the clinical status of a COVID-19 diagnosis: rather than being assessed on the basis of a constellation of symptoms, as is the case for most diseases, a case is declared a case on the base of a laboratory test, almost always a “Reverse Transcriptase Polymerase Chain Reaction” (RT-PCR) assay. And an RT-PCR test is a very sensitive test, capable of detecting very low levels of virus particle concentration (AKA “viral load”). It’s actually very impressive that a laboratory technology such as PCR, which would ordinarily require PhD-trained scientists to understand and operate, was rolled out so quickly and widely, and is now operated by hundreds of thousands of hourly-salary technicians, millions of times per day, with extremely low error rates. This is one of the scientific responses to the pandemic that went very right.
With every benefit there is a cost, however. In this case, the ability to detect extremely low levels of viral load collides with the characteristic response of a correctly-functioning, vaccine-primed, SARS-CoV-2-aware human immune system. As we have already discussed, when a human organism in possession of such an immune system is attacked by the virus, the virus does not explode on contact or bounce off some kind of impenetrable armor. Instead, the virus gains entry and begins to infect cells and reproduce itself. Early on in the process, however, the immune system becomes aware of the infection and duly moves to shut it down. What level of peak viral load can be attained before the response gains the upper hand is a matter of competing rates—rate of viral growth versus rate of various immune system infection-clearing processes. With the original SARS-CoV-2 strain, and some of the early prominent variants, it was very clearly the case that a lot of “breakthrough” infections that people were panicking over, and which were ostensibly lowering estimates of vaccine protective effectiveness against infection, were actually cases of perfectly normal vaccine-primed immune systems doing their jobs without a fuss, and of RT-PCR test ringing up “Positive” based on the very low viral loads characteristic of a failed infection. Hence, Type 3a, “False Breakthrough”.
But wait. Something’s not right. Why is this super-sensitive assay being fooled?
In my previous post, on Omicron’s actual status in the typology of breakthrough infections, I alluded near the end to a fact that strikes me as requiring much more of an explanation than is usually given. The fact in question is that in the SARS-CoV-2 epidemic, every time a new, rapidly-reproducing variant has burst on the scene, within a few months it has driven all its rival variants clean out of the community-spread genome.
Take a look at The Covariants.org Per-Country page, and let your mouse scroll over the United Kingdom chart—the UK has been consistently sequencing more specimens more assiduously, completely, and regularly and since far earlier than any other nation, as you can see from the number of sequences (the “num seq” pop-up figure), so it’s the best case study. You can see that until 12 October 2020 there was a variant winningly named “EU1” cruising to dominance over its competitors. But on 14 September something new had happened: 3 specimens had turned up with a new variant, named “Alpha”. By 8 March, Alpha has secured 98% of the circulating genome (34648/35670 specimens) and appeared on its way to crushing EU1 (173/35670 specimens), but again, something new had just happened: 6 specimens of a new variant, “Delta” had just shown up. You already know how this story goes: Delta swept the board. By Mid-August, Alpha sightings were as common as Elvis sightings (21/75887), and EU1 sightings were like unicorn sightings (2/75887). In the 1 November data—just prior to Omicron’s appearance—out of 96120 specimens only 9 were not Delta or some cousin of Delta. At that level, to explain the non-Delta signal, we’re really looking at accidents rather than spread: things that interfere with good mixing, such as small, isolated communities perhaps, or travel from distant areas. Natural alternatives to Delta had clearly been driven out of the larger circulating SARS-CoV-2 genome by the time Omicron showed up.
How Can We Know What Kind Of Breakthrough Infections Omicron Produces?
At the end of my previous post on breakthrough infections I suggested that there are in fact very good reasons to believe that the Omicron variant is not creating “dangerous” (to the patient) breakthrough infections, that is, it is not creating “Type 1 breakthrough infections”, in the typology that I set out in that post. The ability to create Type 1 breakthrough infections would make a variant very dangerous, because an infection by such a variant would evade vaccine-primed human immunity, and the patient’s immune system would have to start from scratch on the time-consuming process of learning to identify the virus, and to create the armament of antibodies and immune cells to fight it without the assistance of a vaccine. The “Type 3” breakthroughs (whether of the “false breakthrough” or “semi-breakthrough” sub-types) are much less dangerous. Neither sub-type actually evades vaccine-primed immune response: they merely appear to, because the rapid reproduction of the virus in the body leads to measurable, often infective levels of viral load despite neutralizing antibodies’ efforts to restrain that growth; but the infection’s early doom is already sealed, because the cellular part of the adaptive immune system—specifically the killer T-cells—are on their way, and will wipe it out in short order. So while the infected individual may be infective (Type 3b), he or she is not usually at risk of severe disease.
This is an orderly proceeding for an immune response to an infection, incidentally. Neutralizing antibodies are only the first layer of the adaptive immune system, and despite their prominence in media discussion of vaccines and therapies they are not responsible for either preventing severe disease or clearing an infection. Antibodies merely slow down the rate of growth of the infection, buying time for the real heavy hitters—the T-Cells—to be mobilized to fight off the infection. That’s the key difference between Type 1 and Type 3: if a variant can create Type 1 breakthroughs, the T-Cells can’t fight it, whereas if it can only create Type 3 breakthroughs, the T-Cells will kick the crap out of it.
So it actually matters what kind of breakthrough infections Omicron is producing, and that’s the reason I’m trying to create some badly-needed clarity in the discussion surrounding the wretchedly ill-chosen term “breakthrough”. What, then, is the evidence that Omicron is not a Vaccine Escape Variant of Concern?
It’s amazing to me how much damage a badly-chosen scientific term can do, in a high-consequence scientific field such as COVID-19 epidemiology. The term “Breakthrough infection”, which quickly filtered from journal literature on vaccine effectiveness to public media, turns out to be so poorly defined that it even confuses scientific discussions, and when it enters public discourse it engenders mostly misinformation and panic. It is downright daft terminology, which is unfortunately as ineradicable now as the virus itself. In this post, I’d like to at least try to fix it a little, so the damn term can do some useful work for a change.
I haven’t posted a lot about vaccine efficacy lately, largely because the frenzy of vaccine development and clinical trial results basically slowed way down around June 2021, and there hasn’t been that much to write about since on the subject. I’ve been thinking about what to do with this site ever since. Some people do seem to find it useful—there have been nearly 25,000 visitors from all over the world since I started writing about vaccine efficacy, and I hope that those people found information that was valuable to them. To the extent that they did, it makes me somewhat proud, since I am a statistics person rather than a clinically-trained person, so having an impact in the COVID-19 pandemic, however small, feels like an achievement. On the other hand, that same lack of clinical training means that I have to watch myself so as to write things that are justified by data, and keep from making wild, poorly-informed statements that do more harm than good. I feel that so far I’ve stayed on the right side of that line.
I may risk that balance in the next phase of this blog’s development.
I plan to write a few observations of my own on the state of epidemic surveillance, epidemic modeling, and epidemic data, specifically with respect to the COVID-19 epidemic. I am doing this in part because I’ve been more deeply involved in data-driven epidemiological work, especially with respect to vaccine effectiveness (different from efficacy, because it characterized real risk reduction in real populations, rather than “pure” clinical properties of vaccines), culminating in a paper demonstrating the possibilities of large-scale data analytics for epidemic surveillance and vaccine assessment. In the process, I have become somewhat frustrated with the state of data curation and availability, but also with some of the model-premises underlying discussions of subjects such as vaccines, “breakthrough” infections, variants and their potential for vaccine escape, and so on. In my opinion there is a great deal of intellectual confusion about these terms and concepts, and this confusion is feeding needless media and policy panic (and occasionally distracting from necessary panic). I feel I need a place to write down everything that I feel is (usually) subtly or (occasionally) grossly wrong about the public and scientific discussions of these issues. And I happen to have a more-or-less epidemiological blog. So I might as well do it here.
The cost of this change of direction is that I doubt that I can maintain the careful stance of defensible scientific statements that I tried to keep this blog to so far. Quasi-editorials on epidemiology by a statistically well-informed but barely-clinically-literate observer of the field should by no means be taken as authoritative refutations of anything, or in fact as anything more than spurs for further discussion by people working in the field, with whom I would be delighted to engage, and be told in exhausting detail all the reasons why what I’m writing is wrong-headed. I do listen, and try to learn. But I will also argue. I feel that I will have accomplished something useful if I at least bring to light a few unexamined or under-examined assumptions, and occasion a fruitful discussion of those assumptions, even if in the end I am the only one who feels educated by the process.
Nonetheless, I have a strong suspicion that I’ve seen some real issues—defects in how clinical data is created and curated and made available, defects of modeling, catastrophic terminological confusion—that need to be brought into the light. I’ll be discussing these in a series of posts.
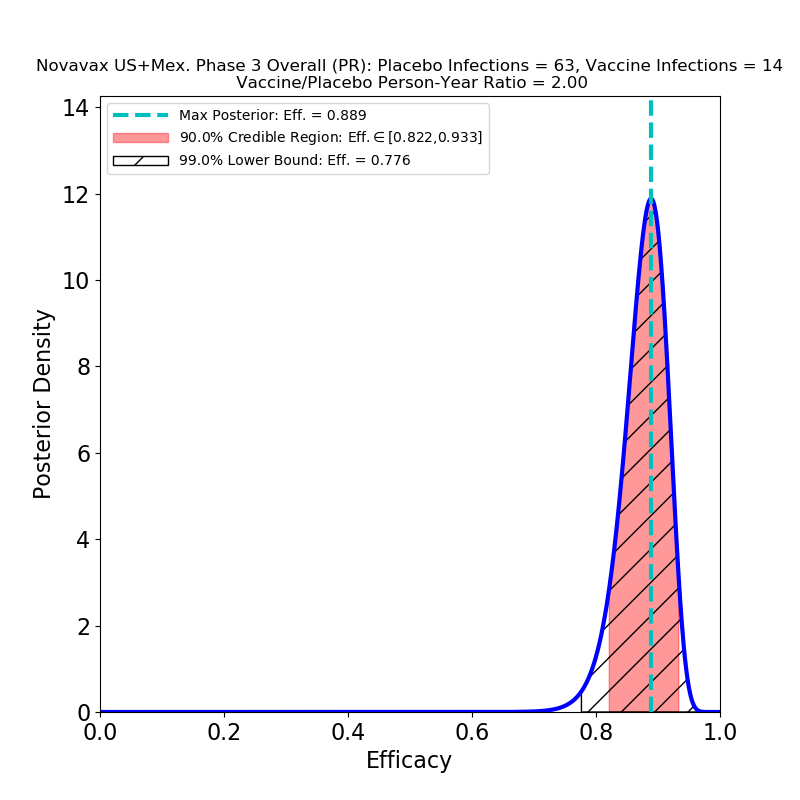
Novavax issued a press release today with final results of a second phase 3 trial — a separate one from the one that the company conducted in the UK, which I discussed in this post. It appears to be a larger study (about 30,000 participants, twice the 15,000 of the UK study) and randomized 2:1 vaccine-to-placebo to increase the efficacy signal. I’m not certain of the reason for the study duplication, but there are some undoubted benefits that have resulted from it: having been conducted later in the epidemic than the trials of earlier vaccines, this study saw more “Variants of Interest” (VOI) and “Variants of Concern” (VOC) as defined by the CDC, and was able to target them specifically in assessing efficacy. The result is surprisingly good news.
Here are the results:
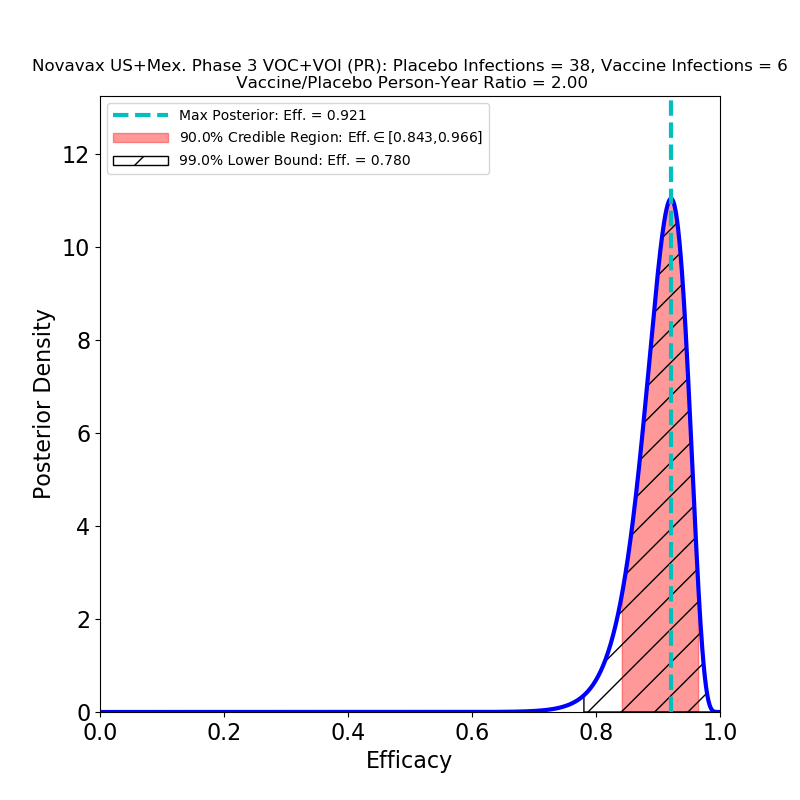
Efficacy of Novavax NVX-CoV2373 COVID-19 vaccine in US/Mexico Phase 3 trial. Left panel: overall efficacy. Right panel: Efficacy against Variants of Interest (VoI) and Variants of Concern (VoC) as defined by the CDC. For an explanation of the features in these plots, see thispost.
The first point is that this vaccine is in the same sort of efficacy category as the Pfizer/BioNTech and Moderna vaccines — perhaps a few percent lower, but still this is spectacular performance, with a peak at 89% (Novavax claims 90.4%, I’m not sure what the source of the small discrepancy is, but it’s probably not important). Given that this is a vaccine that stores at 2-8 degrees C, we now have another important tool for large-scale global vaccination programs, and none too soon.
The second point is performance against variants. Compare the right panel to the left: This is not what I expected, at all. There is no significant decrease in the efficacy of the vaccine against variants. Which could mean broad protection against mutated strains of SARS-CoV-2. Of course, the press release does not specify which variants are implicated, and the lumping together of several mutations may mask some bad news that will only be discernible later.
Recall that a Variant of Concern is defined as one “…for which there is evidence of an increase in transmissibility, more severe disease, significant reduction in neutralization by antibodies generated during previous infection or vaccination, reduced effectiveness of treatments or vaccines, or diagnostic detection failures.” The B.1.1.7 (“UK”) variant is a higher-transmissibility VoC, but it seems to be effectively blocked by the present crop of vaccines. On the other hand, the B.1.351 (“South Africa”) variant is a reduced-vaccine-effectiveness VoC, since it seems to have some trick that reduces vaccine-induced immunity, to a poorly-known extent that depends on the type of vaccine — in fact, Novavax’ own Phase 2b South Africa trial took a major hit from this variant. Obviously, lumping these two VoCs together in a single study would not be a useful thing to do, since might conceal some serious trouble to be expected later on. If, for example, the mix of VoCs in the US and Mexico is currently not rich in B1.351, but the proportion of that variant grows in the next few months, it is possible that we could see the efficacy of this vaccine decline.
On balance, however, I would say the story here is guardedly positive. As usual, more information is needed than is supplied in a press release.
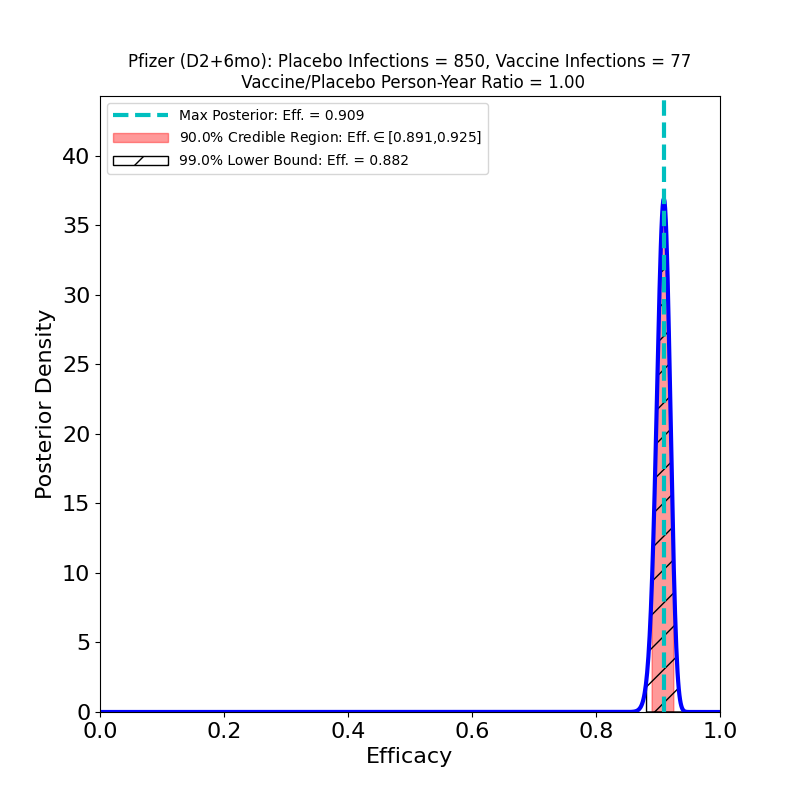
Anotherpress release by Pfizer, this one with results from their main phase 3 trial (46,307 participants). They have followed up participants for 6 months post shot-2. The press release has some slices of data, which will certainly be released in more detail at the time of their application for full FDA approval — and presumably when they submit a journal article.
Here are the two things that caught my eye:
Pfizer/BioNTech, phase 3 study, shot 2 + 6 months follow-up. Left panel: overall efficacy. Right panel: South Africa results for confirmed infections by B.1.351 variant. For more information about the features of these plots, seethis post.
On the left we see more confirmation of what we knew: the superb efficacy of the Pfizer/BioNTech COVID-19 vaccine. There is now so much data that the uncertainty on the efficacy is tiny. The peak posterior probability estimate in the plot is 91%. The result is basically consistent with the previous results. It’s worth remembering that the original targets for vaccine efficacies when the development effort began in early 2020 was “anything over 50%.” The fact that this generation of vaccines is ringing the bell in the 70-90% range is really an astonishing feat.
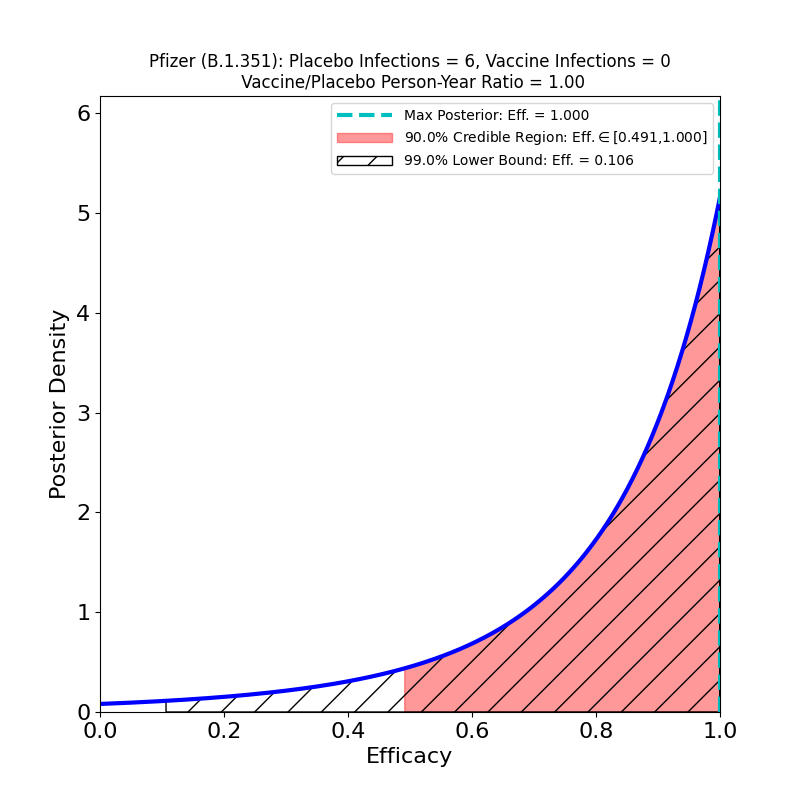
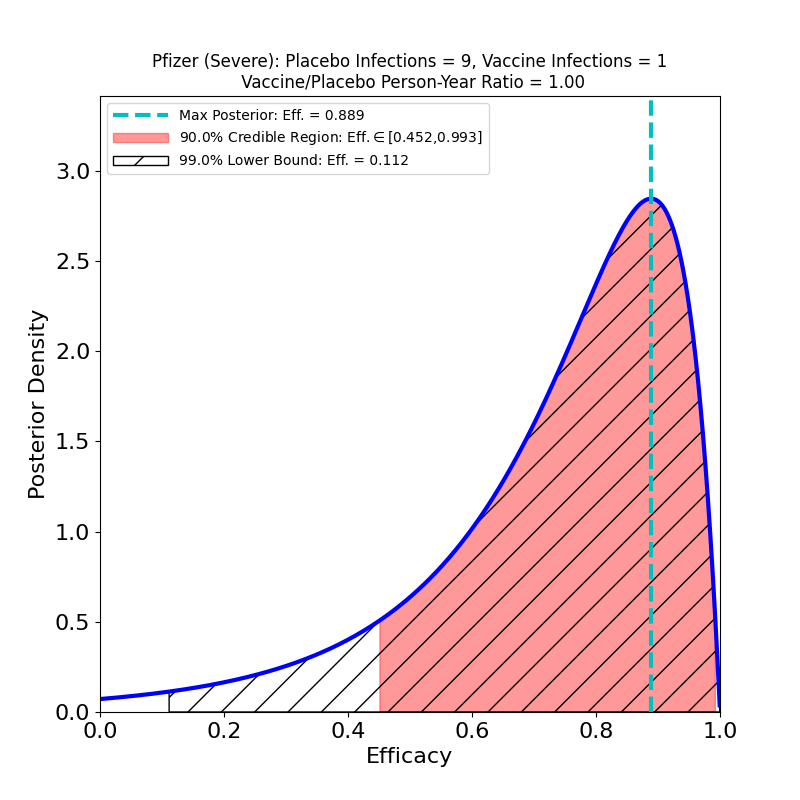
Now to the right-hand panel. The trial has a South Africa arm (well, at 800 participants, more like a “finger”). Of these, 9 placebo-group participants became infected, and zero vaccine group-participants. Of the 9 placebo-group participants, 6 were confirmed to have been infected by the B.1.351 lineage. If you have 6 placebo infections, and zero vaccine infections, you get the plot on the right hand side. This is what the flacks who work for Pfizer’s PR department have to say about this:
In South Africa, where the B.1.351 lineage is prevalent and 800 participants were enrolled, nine cases of COVID-19 were observed, all in the placebo group, indicating vaccine efficacy of 100% (95% CI, [53.5, 100.0]). In an exploratory analysis, the nine strains were sequenced and six of the nine were confirmed to be of the B.1.351 lineage. These data support previous results from immunogenicity studies demonstrating that BNT162b2 induced a robust neutralizing antibody response to the B1.351 variant, and although lower than to the wild-type strain, it does not appear to affect the high observed efficacy against this variant.i
OK, now look at that plot. Does that say “100% efficacy against B.1.351” to you? Because to me it says “we got bupkus for evidence, since we had too few people in South Africa participating in this study.” The 90% credible region starts at 50% efficacy!
You should also be aware that the stuff about “robust neutralizing antibody response” is based on this paper, which however showed that in-vitro neutralization of B.1.351 required far more concentrated vaccine-induced antibodies than were required for other variants — I cannot understand how the how one could possibly characterize that result as “robust”. In any event, its a wet lab result, not a clinical trial. We still don’t have any quality evidence about the performance of the mRNA vaccines against the B.1.351 variant. And that has me very worried.
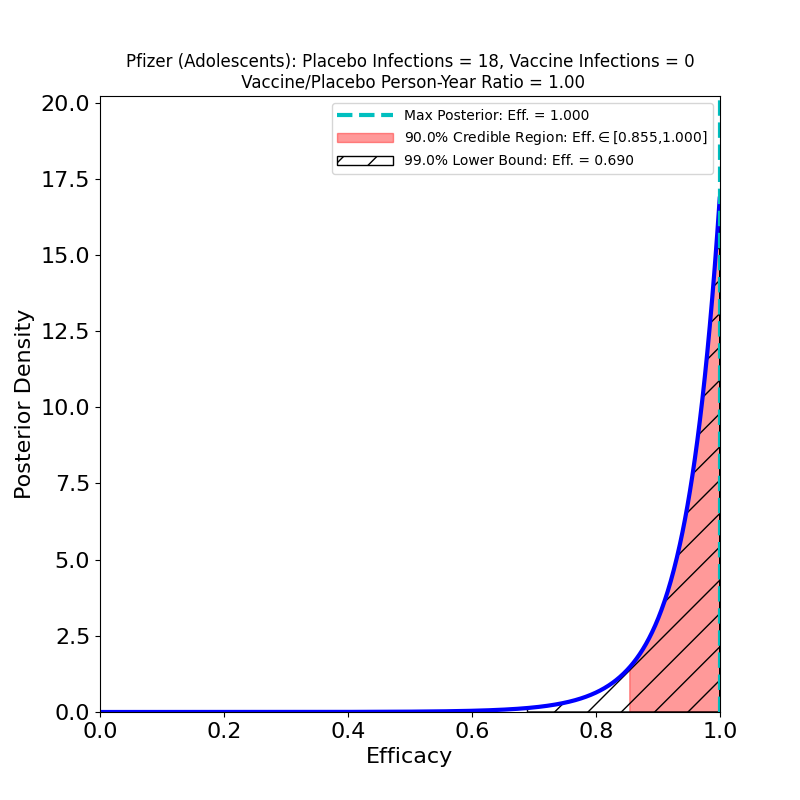
Pfizer has a press release today concerning its phase 3 trial of its BNT162b2 COVID-19 vaccine in U.S. adolescents, ages 12-15. There’s only one topline number from the trial in the press release — 18 cases in the placebo group, 0 in the vaccine group. The result is the following plot:
Efficacy of Pfizer/BioNTech COVID-19 vaccine in U.S. adolescents, ages 12-15. For an explanation of the features in this plot, seethis post.
This is a very impressive result — with 90% probability the efficacy in adolescents is higher than 85.5%. It should probably not be regarded as a very surprising result: the immune systems of adolescents are generally better-functioning and more responsive than those of adults, so it would be more surprising if the efficacy were lower than the result found for older individuals. The more relevant part of the study is probably the fact that the vaccine is safe to use even at age 12, which is good news.
A few comments:
(1) The press release does not state the time period over which the study was conducted, so it isn’t possible to assess from this information the extent to which protectiveness extends to variants currently in circulation in the US.
(2) This was a small study — about 2,200 individuals (as opposed to 45,000 in the principal study). For this reason, the efficacy results are less constrained (the curves are broader) for adolescents than for older individuals.
(3) As usual, the fact that there were zero COVID-19 cases in the vaccine group in this small study is misleadingly described as representing “100%” efficacy in the press release, a claim picked up by sciencenewsreporters who should know better. From the above plot, a plausible value of the efficacy is certainly in the high 90s, but nothing is 100%. When the vaccine is administered to millions of adolescents (as opposed to the 2200 in this study) there will certainly be a few vaccinated adolescents who contract COVID-19. This will not be a vaccine failure, just an illustration of how small probabilities work.
Pfizer will apply to the FDA for an Emergency Use Authorization “as quickly as possible”. When they submit their information packet — which invariably contains a wealth of information, exceeding even what is later published in refereed journal articles — I’ll mine it for another post.
AstraZeneca announced today its results from the phase 3 clinical trial that it carried out in the US, Chile and Peru. This is a new trial, required for approval of the vaccine for use in the US in consequence of the company’s amateurish mismanagement of its original clinical trial. The company released new information today correcting another miscue — a 22 March press release (asserting 79% efficacy) that apparently drew on an incomplete dataset. The discrepancy was noticed by the study’s independent monitoring board, which issued an unusual rebuke to the company as a result.
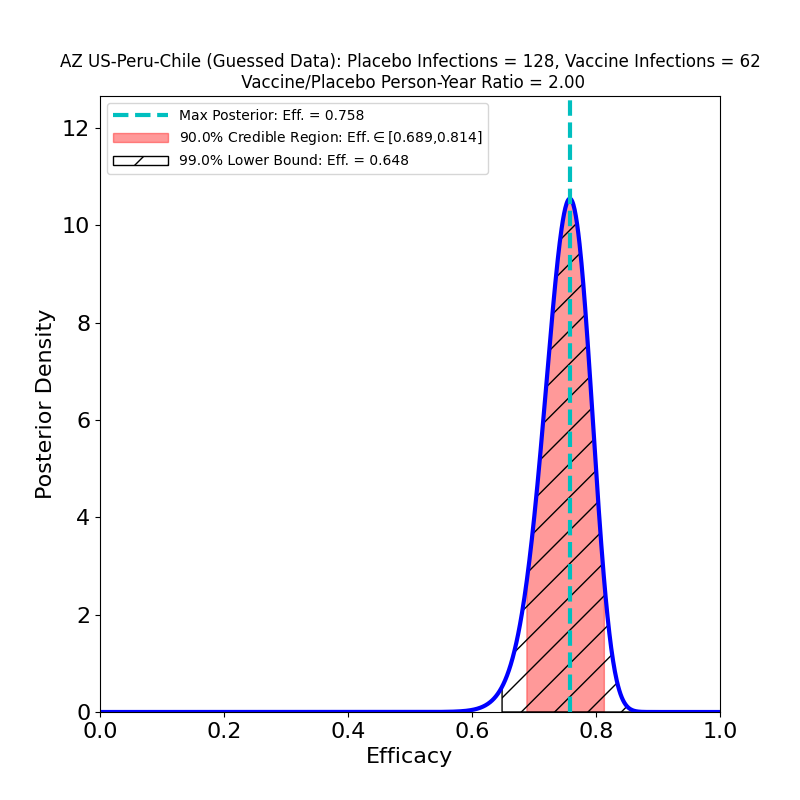
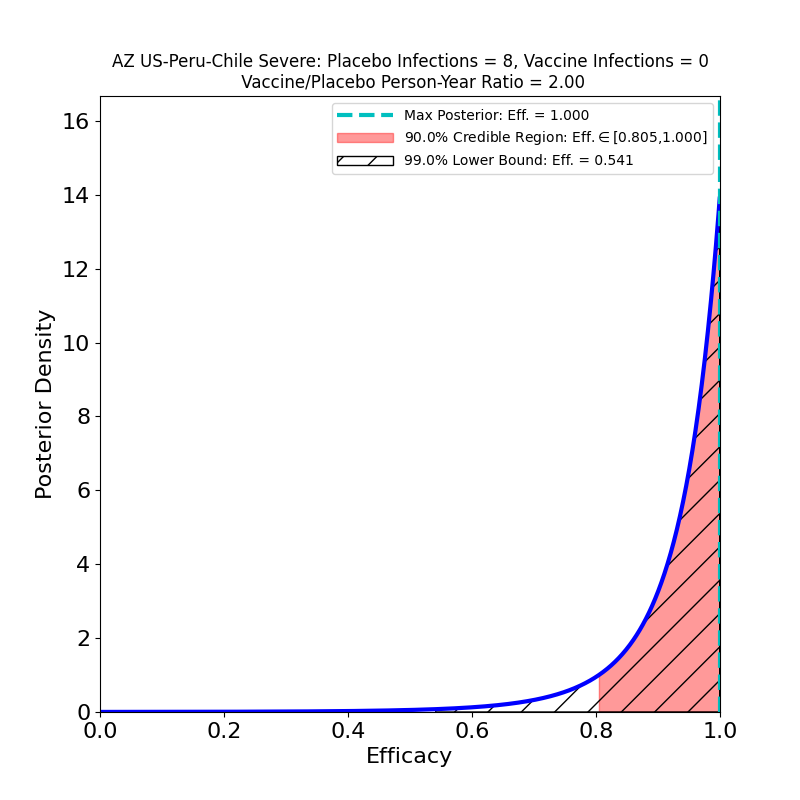
The current press release does not in fact release any data, only AZ’s efficacy analysis, in which they assert an overall efficacy of 76%, with a confidence interval of [68% — 82%]. However, from this result, and from the facts that (1) the study adjudicated 190 symptomatic cases, and that (2) the ratio of vaccine-to-placebo group sizes was 2:1, it is possible to infer that the study observed about 128 cases in the placebo group and 62 in the vaccine group. In addition, the press release divulged that there were 8 “severe” COVID-19 cases in the study, all in the placebo group. So we can make the following pair of plots:
AstraZeneca efficacy analysis. Left panel: overall efficacy, based on guessed “data”. Right panel: efficacy against “severe” disease. For an explanation of the features in these plots, seethis post.
In the left-hand panel we see that the claimed 76% efficacy is in fact the peak of the distribution — this is by design, since it’s how I guessed the data. The 90% credible region is [69% — 81%], not terribly different from the confidence interval asserted in the press release (technically a CI is a different measure of uncertainty from the Bayesian credible regions used here). We can also see that the retracted claim of 79% efficacy is not inconsistent with the data, so the error is not really as consequential for the analysis as it is for growing AZ’s reputation for committing unforced errors. The result is more tightly constrained that any resulting from AZ’s previous clinical trial (compare the plots in this post), and demonstrates high efficacy, so the situation is improved in that respect.
In the right-hand panel we see the efficacy against “severe” disease. This is what company PR flacks (and credulous journalists) refer to as “100% efficacy against severe disease”. As you can see, with this few cases (8), the efficacy against severe disease is not terribly well constrained — there’s a 10% probability that it could be lower than 80% (the 90% credible region lower bound) and a 1% probability that it could be lower than 54%. It’s probably in the 80-90% range, which is certainly impressive enough. I just get very annoyed that this sort of thing gets reported as “100%” — that’s just a statistically illiterate reading of the situation.
Bottom line: AZ’s vaccine’s performance looks good (at least against variants currently circulating in the US and South America), and the company has finally concluded a competently-administered phase 3 clinical trial. When they apply for an EUA from the US FDA, and their briefing document to the review committee is released, I’ll analyze the data and post updated results.
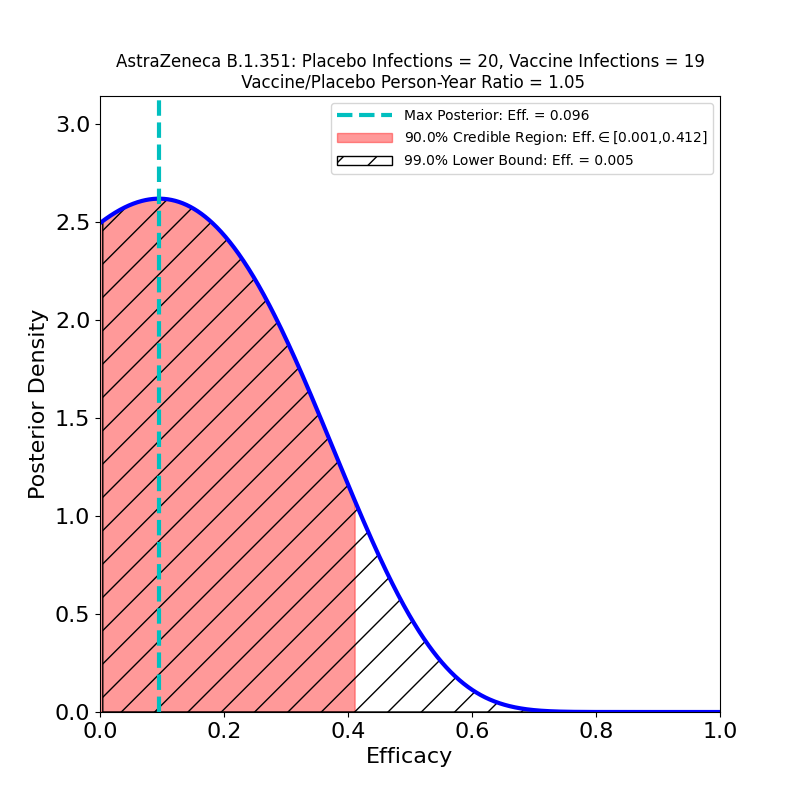
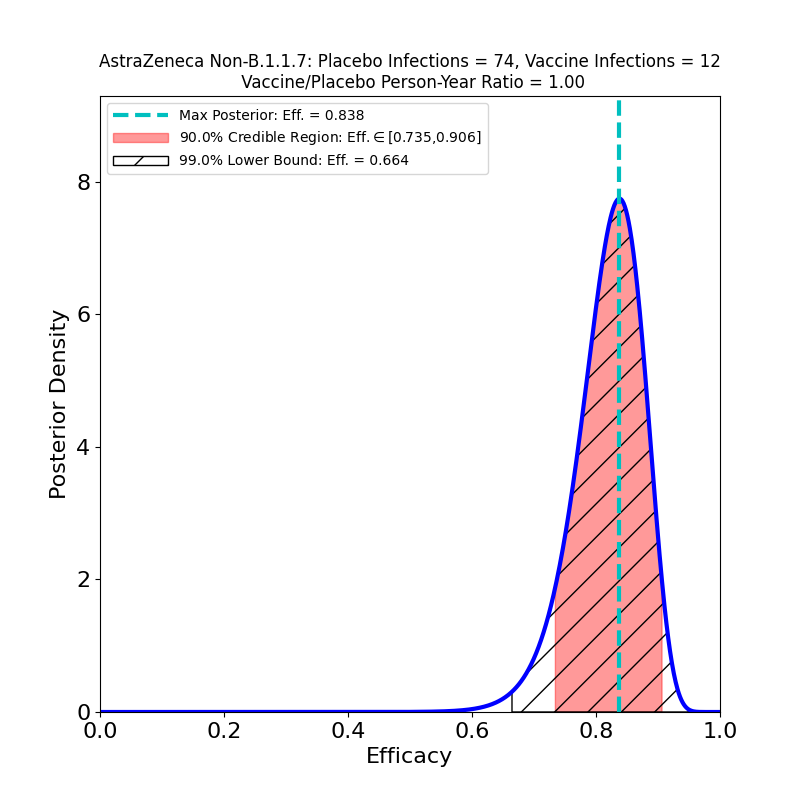
There’s a new journal article at the New England Journal of Medicine, detailing a Phase 1b/2 clinical trial of the AstraZeneca COVID-19 vaccine, conducted in South Africa. The principal thrust of the article is to gauge efficacy against the B.1.351 virus variant now prevalent in South Africa. The news is…not good:
Efficacy of the AstraZeneca COVID-19 vaccine against the B.1.351 variant. For an explanation of the features in this plot, seethis post.
This plot shows the efficacy of the vaccine, restricted to the sample of patients who developed “mild or moderate” COVID-19 (there were no “severe” cases in this small dataset) and were confirmed infected by the B.1.351 variant of SARS-CoV-2. Basically, there is no evidence of protective efficacy against the B.1.351 variant.
This is not to pile on to AstraZeneca, which is having a bad week anyway due to safety concerns. So far, no current COVID-19 vaccine has demonstrated acceptable efficacy against this particular variant (as opposed to the B.1.1.7 “UK” variant, or the P.1 “Brazil” variant). The Johnson & Johnson and Novavax vaccines also had disappointing performance against this variant. Collecting the three South Africa studies together for comparison, we see this:
Currently available South Africa-based clinical trials. Left panel: J&J. Middle panel: Novavax. Right panel: AstraZeneca.
None of these looks particularly good. Part of the reason the AZ efficacy plot looks much worse than those corresponding to the J&J and Novavax South Africa studies is that those studies had about 6 times more data, so the evidence for what protection their vaccines can offer is better than AZ’s evidence — the protection itself might be about the same. Also note that the J&J and Novavax studies did not single out B.1.351 cases, so there are about 5% “classic” SARS-CoV-2 cases in the above plots, and this necessarily improves their apparent efficacy with respect to the AstraZeneca result. Another confounding issue is that because of the incompetence of AstraZeneca’s vaccine manufacturing (which also led to the data issues that I discussed here), the administered doses were not all the same — the article states that vaccine recipients in the trial received “…a 0.33-to-0.5-ml dose (depending on the lot) of the ChAdOx1 nCoV-19 vaccine”, which means they don’t even have a well-controlled idea of how much vaccine they administered in this study.
Note also there is in vitro evidence that the Pfizer and Moderna vaccines will offer at best weak protection against B.1.351 (see here for Pfizer and here for Moderna).
So the story of vaccine-mediated resistance to this variant remains the same as I discussed in this post. At the moment, there is weak evidence for protection against severe disease caused by B.1.351, and no evidence at all for protection against transmission. We’re still on-track for an urgent program of B.1.351-specific vaccine booster shots (Moderna has one already in trials) as soon as they can be developed, approved, and produced. In my opinion the need for such boosters will be clear by late Summer 2021, and getting urgent by Fall.
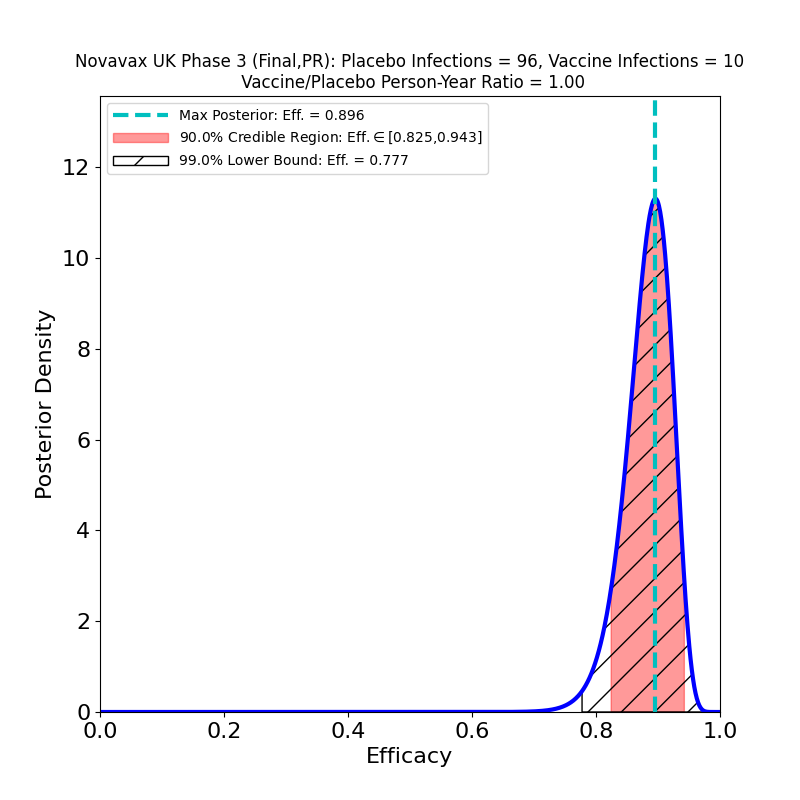
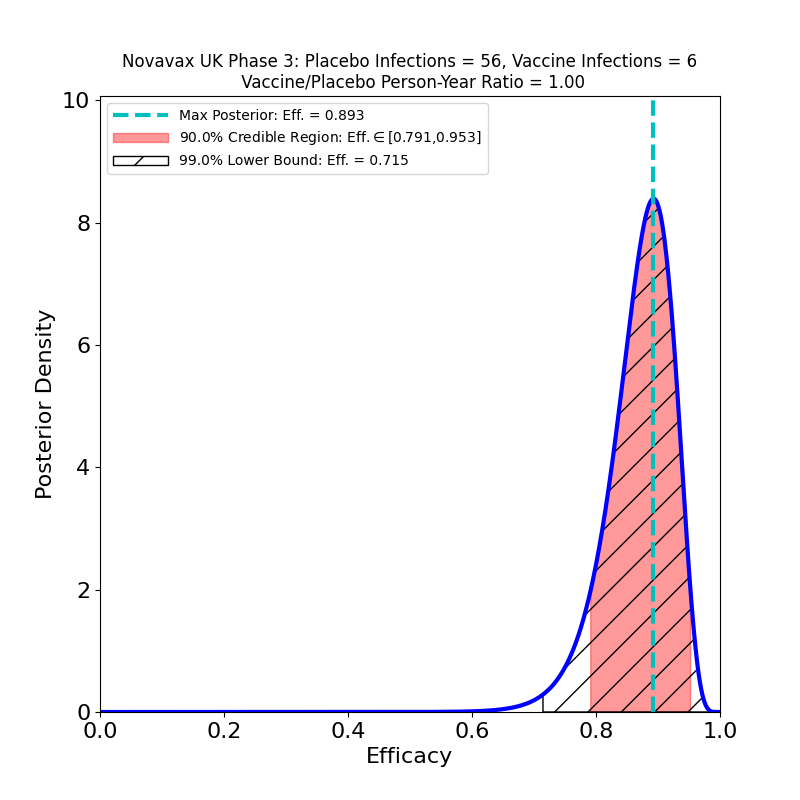
Novavax issued another press release today, with some partial information concerning the now-completed trials, a Phase 3 trial in the UK, and Phase 2b trial in South Africa. The data is a continuation of the data analyzed in this post, and tells a similar story, although with more abundant numbers (and hence less uncertainty). There is some actual data in the press release, but there are also some efficacy estimates not backed by released data, which I can therefore not evaluate here. As usual, when the Emergency Use Authorization request gets to the FDA, a briefing document will be made public with complete trial information. I will issue another update when that happens.
Meantime, here’s what the released data for UK trial looks like:
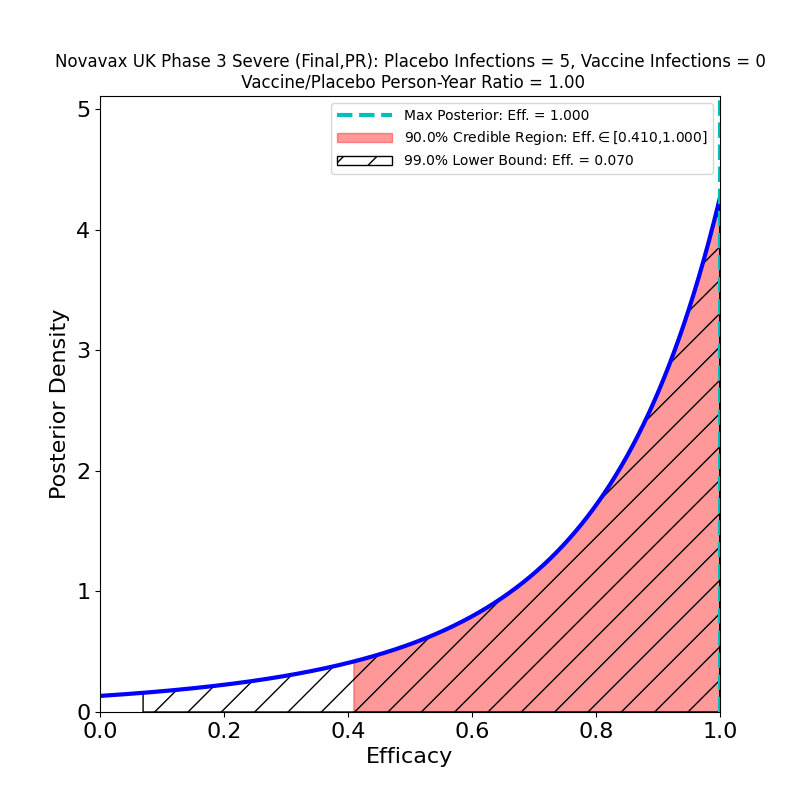
Results from the Novavax Phase 3 UK trial. Left panel: Overall efficacy. Right panel: Efficacy against “severe” disease. For an explanation of the features in these plots, see thispost.
This looks pretty good. Not that different from the preliminary results, but the constraints on efficacy are tighter, since the numbers are higher. The overall result in the left panel is extremely good (most likely value 90%), despite high prevalence of the B.1.1.7 variant. That’s the variant that is more transmissible, and possibly responsible for more severe disease with worse clinical outcomes, but which is also known not to be a so-called “escape variant” — that is, it is not less susceptible to immunity due to previous infection by “classic” SARS-CoV-2, or due to existing vaccines. So it’s not surprising that the Novavax vaccine stops it.
The “severe” disease result is shown on the right. This is what, unfortunately, is described in the press release and reported in naive media outlets as “100%” protection. From the plot it should be clear why this is an inappropriate description of the result — when you have 5 severe cases in the placebo group and 0 in the vaccine group, that’s good news, but nowhere near establishing “100% protection” — based on this data, the 90% credible region says that the protection could be as low as 40%! This kind of thing is the why it is useful to reason in terms of quantified uncertainties, as displayed in these plots, rather than with naive and deceptive point estimates. What we can say based on this data is that there is some moderately weak evidence of efficacy greater than about 40% against severe disease. If Novavax had designed their study as well as Moderna did, including many individuals at risk for severe disease, then they might have collected better evidence (as Moderna did).
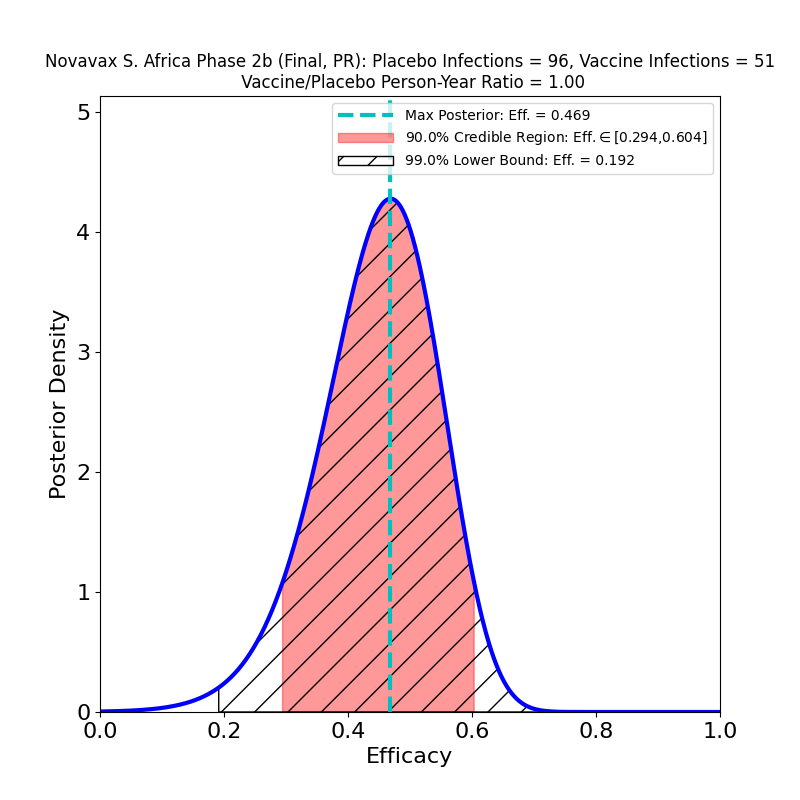
Now, here’s the South African trial data analysis:
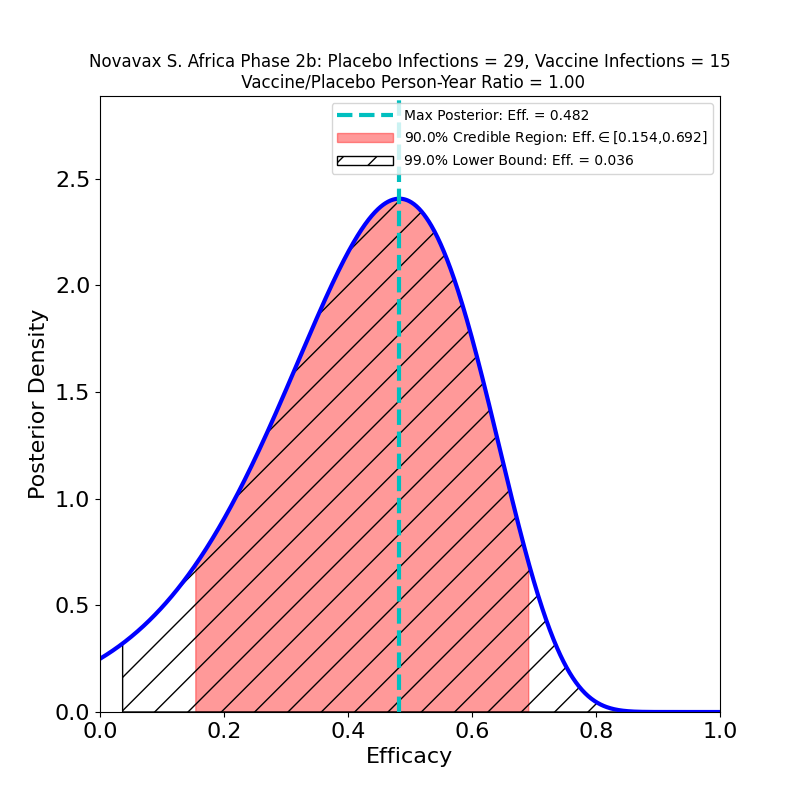
Results from the Novavax Phase 2b South Africa trial. Left panel: Overall efficacy. Right panel: Efficacy against “severe” disease.
In the overall results on the left we see again the troubling effect of the South African “escape variant”, B.1.351, which has already demonstrated its ability to evade immunity produced by the Johnson & Johnson and AstraZeneca vaccines, and for which there is in vitro evidence of decreased immunogenesis by the Pfizer/BioNTech and Moderna vaccines. This result is no worse than the J&J South Africa result, but it’s not any better either. Despite the spin in the press release, it suggests that efficacy to the B.1.351 variant is likely lower than the 50% threshold limit established by the FDA for usefulness. And if the vaccines are this poor at stopping disease, they are almost certainly nearly ineffective at stopping the spread of the virus, since it is being propagated by all all the carriers who get mild or moderate forms of the disease, to say nothing of all the asymptomatic carriers.
This reinforces the point that I made in this post: The B.1.351 variant very likely largely escapes immunity from all existing vaccines. Since (1) we can expect most of the Northern hemisphere to be vaccinated by early summer, so that other variants will be under control, and (2) we know that it only takes a few months for SARS-CoV-2 to travel all over the globe (witness this time it took for the epidemic to spread from Wuhan to the rest of the world in the first place), we can expect that most COVID-19 in the Northern hemisphere will be caused by B.1.351 by sometime this year. Booster vaccines that address B.1.351 are already being prepared — Moderna’s is already in Phase 2, and there’s no doubt that the other manufacturers aren’t far behind. So, we should all get shots as soon as they are available, because they are effective at stopping the spread of classic SARS-CoV-2 and most of its variants. But we should all be prepared to get booster shots this year, as soon as the B.1.351-specific vaccines are available.
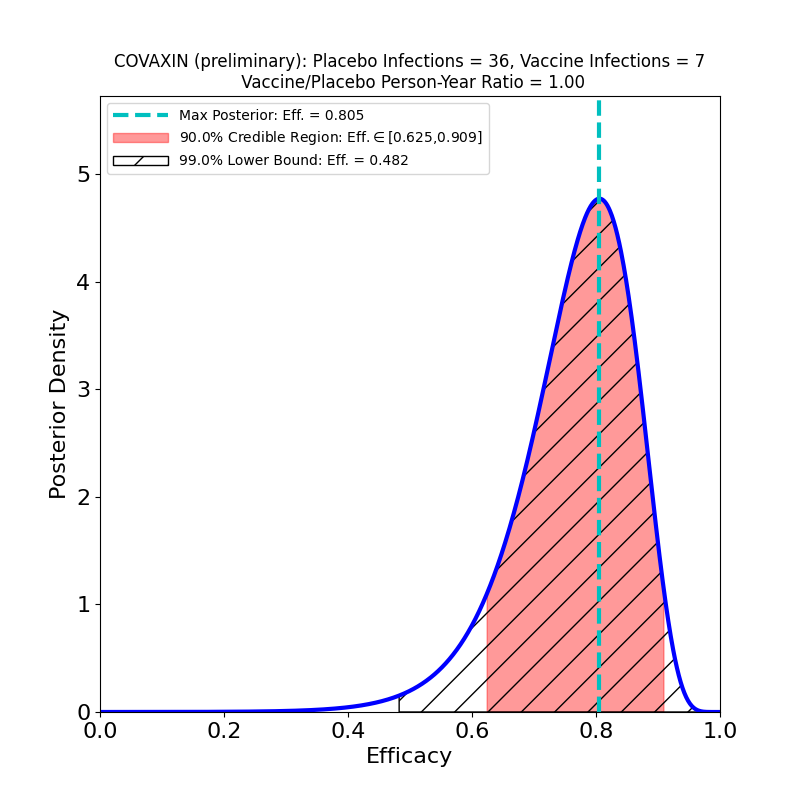
Preliminary results from the phase 3 clinical trial of Bharat Biotech’s COVAXIN vaccine are now available from a press release. The vaccine is a “classic” inactivated virus design. Here’s the Bayesian analysis of the released data:
Analysis of efficacy of the COVAXIN vaccine. For an explanation of the features of this plot, seethis post.
So far so good. The numbers are too low at the moment to constrain the efficacy very tightly, but with a 90% credible region lower bound at 63% and a peak probability density at 80%, it looks very promising — comparable to the AstraZeneca LD+SD result (which was from a full clinical trial!). I’ll revisit COVAXIN when the full clinical trial data is released.
I would invite commentary by experts on how easy it will be to re-target this vaccine at variants that might resist the immunity it produces (such as, in all likelihood, the South Africa B.1.351 variant). In particular, can variant-targeting boosters be manufactured quickly at large scales? This is going to be a key question going forwards, as I discussed in this post.
The FDA’s approval of Emergency Use Authorization of the Johnson & Johnson COVID-19 vaccine is being greeted ecstatically and uncritically by public officials and media. In my opinion, this is an indication that hardly anyone has actually looked at the data supplied by the company to the EUA committee, or read the briefing document in detail.
I wrote up a quick but careful analysis last week, which you may review here.
For present purposes, I’ll note only in passing the statistical illiteracy of journalistic celebrations of “85 percent efficacy against severe forms of COVID-19 and 100 percent efficacy against hospitalization and death” (NYT), figures that ignore both the considerable uncertainties in efficacy estimates and the carefully cherry-picked data that produces such numbers by nimble selections of geographical subregions of the trial, and by passing back and forth between results for 14 days and 28 days post-vaccine, whichever produces the better-seeming (though not actually better) result.
The point that I wish would draw notice is that the South African arm of the trial suggests that a variant crisis is imminent. The J&J vaccine is marginally effective at stopping transmission of the B.1.351 variant that is 95% prevalent in South Africa, and it’s efficacy against the severe disease could actually be as low as 50%. Here are the two relevant plots from that arm of the trial:
South Africa results. Left panel: Protection against “moderate or severe” disease. Right panel: Protection against “severe” disease.For an explanation of the features of these plots, seethis post.
The right-hand figure offers some reassurance about “severe” disease (although if you think it means 80% you should not work as a science reporter). The left-hand figure, however, is extremely worrying. It says that the vaccine does nothing to restrain the spread of the virus, since all those “moderate” COVID-19 cases are shedding virus, and so are a nearly equal number of asymptomatic cases.
Here are some consequences:
B.1.135 Is The West’s Future Native Variant
It took less than 3 months for the original SARS-CoV-2 virus to travel from Wuhan to the U.S. and become an uncontrolled epidemic. It’s probably safe to assume that the freely-propagating B.1.135 variant, unrestrained by vaccination, will soon have high prevalence in the US and in Europe as well. It has mutated its way to a fitness advantage, so it will likely take over the SARS-CoV-2 genome within in a few months, probably by June at the latest.
It’s Not Just J&J’s Problem
I have no beef against J&J, and don’t mean to single the company out for criticism. There is plenty of evidence now that this is not just a J&J vaccine issue. We already know that the Novavax clinical trial had a South Africa arm that found the same thing. And South Africa has halted it’s rollout of the AstraZeneca vaccine, asserting that it “…offers minimal protection against mild and moderate cases”, as a consequence of the variant’s prevalence.
We don’t know how B.1.135 affects the efficacy of the Pfizer and Moderna vaccines, or that of the Sputnik V vaccine for that matter, since their clinical trials saw essentially zero prevalence of that variant. One may hope that since those vaccines appear to induce a more robust immune response, they may yield broader immunity against variants. But without new trials, all we can do is wait and find out.
Transmission Matters
Much of the media celebration appears to center on the ability of the J&J vaccine to prevent “severe” disease. As we saw above, even this ability is reduced in light of the advent of B.1.135. But ignoring the ineffectiveness of the vaccine at preventing transmission is madness. The probability of a mutation that increases transmissibility (or disease severity, for that matter) is proportional to the infection rate — the more cases per day, the higher the chances of a more dangerous mutation. The reason that we’re seeing proliferation of variants now, to an extent not noticeable during the March or August waves, is that the Winter wave case count eclipsed that of the other two — there have been many more mutation opportunities since October 2020 than there were before.
A vaccine is a tool for epidemic control, not a treatment or a cure. Focusing on prevention of the worst disease outcomes while ignoring transmission prevention totally misses the point. It’s tantamount to celebrating relief now, while ignoring the worse trouble to come.
A Silver Lining
The one reason that I can see not to panic now is that the next-generation vaccines that have come into being in the past year — mRNA and adenovirus vector — are reportedly very straightforward to re-target at new variants, and updated versions can be quickly produced at industrial scales, at least after current supply-chain bottlenecks are sorted out. What this means is that while everyone who gets a J&J, AZ, or Novavax vaccine now will be needing a booster by summer (and this may also be true for the Pfizer, Moderna, and Sputnik vaccines as well), at least there is reason to believe that such boosters will be widely available. For this reason, the public-health messaging on the J&J vaccine is correct: if you are offered a shot of the J&J vaccine, you should accept it. Just make sure you get a booster as soon as it is available.
The epidemic control strategy has to be to get total infection rates down (to slow the rise of newer, more dangerous variants), while rapidly developing, producing, distributing, and jabbing updated boosters to stamp out existing variants. And doing this everywhere, including in third-world nations that can’t afford to fund their own rapid-response anti-variant campaigns, because any large reservoir of transmitted virus is a potential source of newer, even more dangerous variants.
Moreover, the summer-booster messaging needs to start now. We all know how delicate public support for mass vaccination campaigns is, and how easily it can be poisoned by militantly ignorant, scientifically illiterate disinformation spread by the anti-vaxxer crowd. Those people will have a field day with rising-again infection rates among vaccinated individuals that are to be expected this summer and fall, unless there’s a comprehensive public health messaging program about variants and boosters. The sooner the better.
And reporters need to get smarter about reporting “victories” like this one, that carry seeds of future problems. When the victory turns out to be not as complete as first reported, and possibly even reversible, the consequences for public support of mass vaccination campaigns are unlikely to be good.
The FDA Emergency Use Authorization (EUA) committe that will decide whether to approve the J&J/Janssen vaccine meets Friday, 26 February 2021, and as promised, the FDA has released the briefing document submitted by the company two days in advance. There’s a great deal of information in such documents, often more than appears in the corresponding journal article, when it is published..
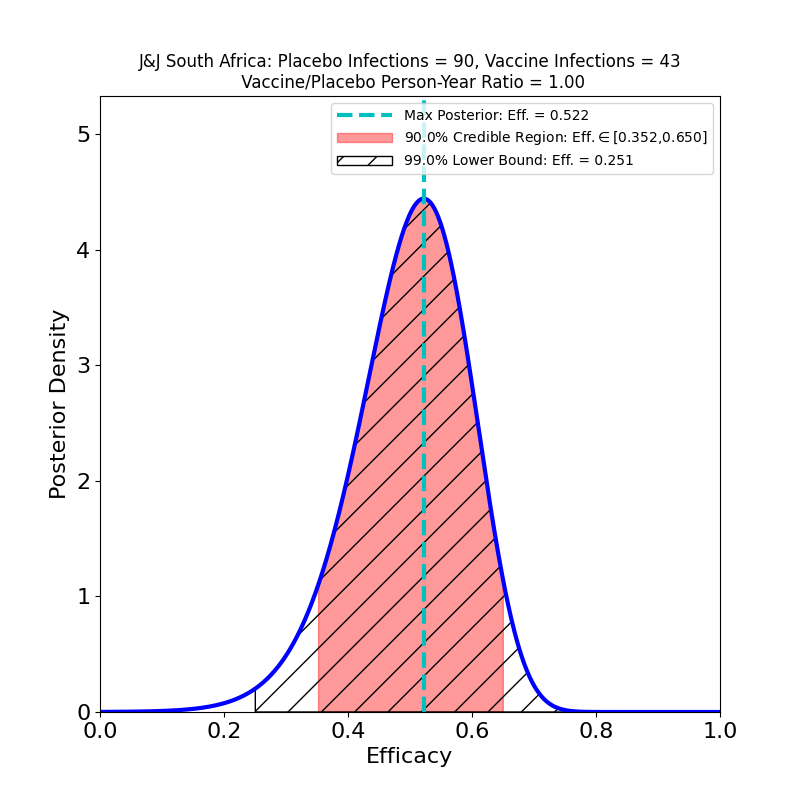
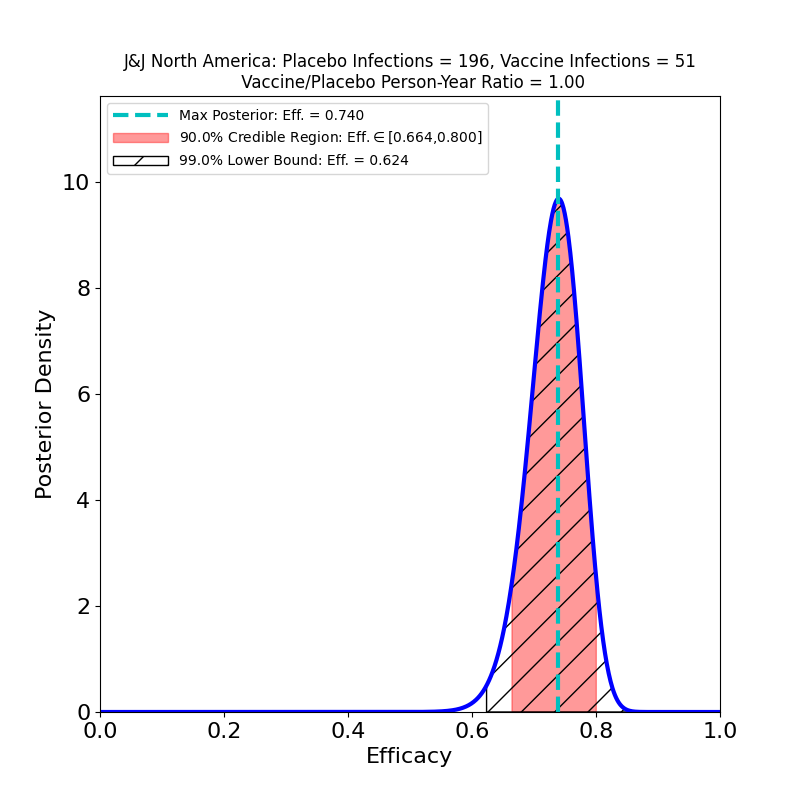
The phase 3 clinical trial was conducted in three countries: the US, Brazil, and South Africa. This is interesting because of the different incidences of SARS-CoV-2 variants prevalent in those locations at the time of the trial: differences are informative about protective efficacy against different variants. In addition, the data cut that seems most relevant is distinguishing the overall “Moderate+Severe COVID-19” endpoint from the “Severe COVID-19” endpoint (as usual, one has to read the document in detail to understand the precise definitions of terms such as “Moderate” and “Severe”). So, let’s take a look.
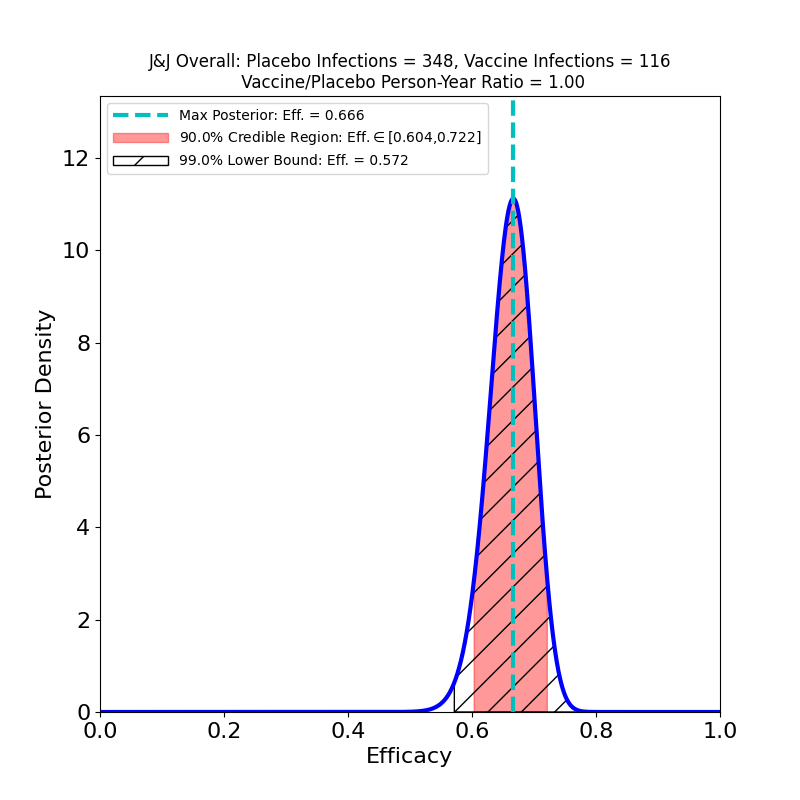
Here’s the top-line efficacy, for “Moderate+Severe” endpoints, across all three countries, infections beginning 14 days post-vaccination.
Overall Efficacy of the J&J/Janssen vaccine. For an explanation of the features of this plot, seethis post.
The overall efficacy looks pretty good: 67%, with pretty tight bounds. One should be cautious of invidious comparisons with the crazy-high efficacies of the Moderna and Pfizer/BioNTech vaccines: For an individual, 67% means a 2/3 reduction in the probability of contracting COVID-19 in any interaction with an infectious person. For a vaccinated population, this kind of efficacy means that the virus is in serious trouble: it means that if you could vaccinate everyone with this efficacy, you could get to herd immunity almost immediately (assuming an R0 of 3-ish).
So far so good. Let’s dig into the subgroup analyses. First, here’s protectiveness against “Moderate+Severe” COVID-19 across countries:
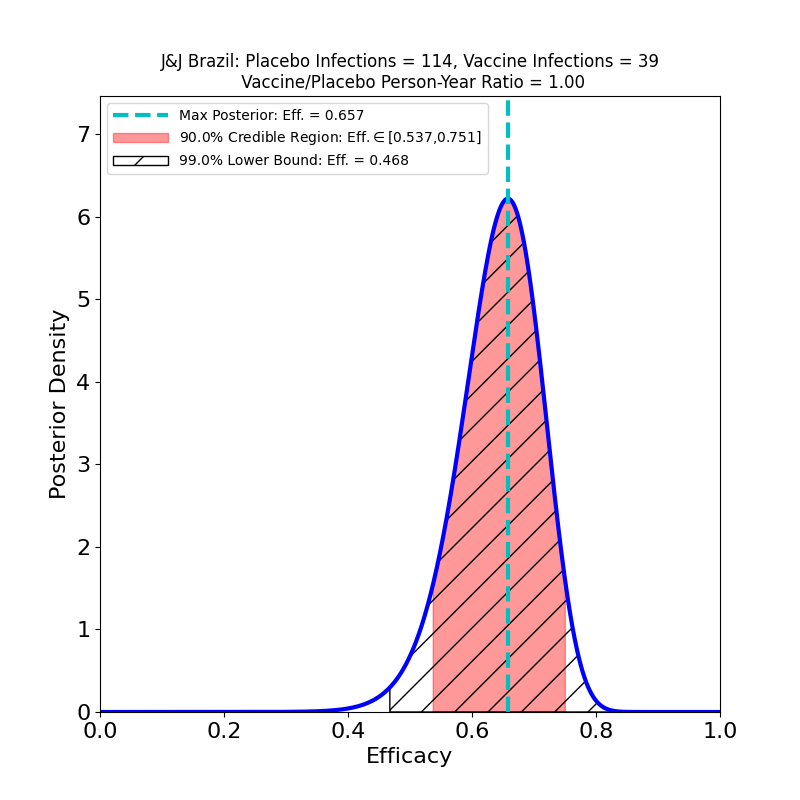
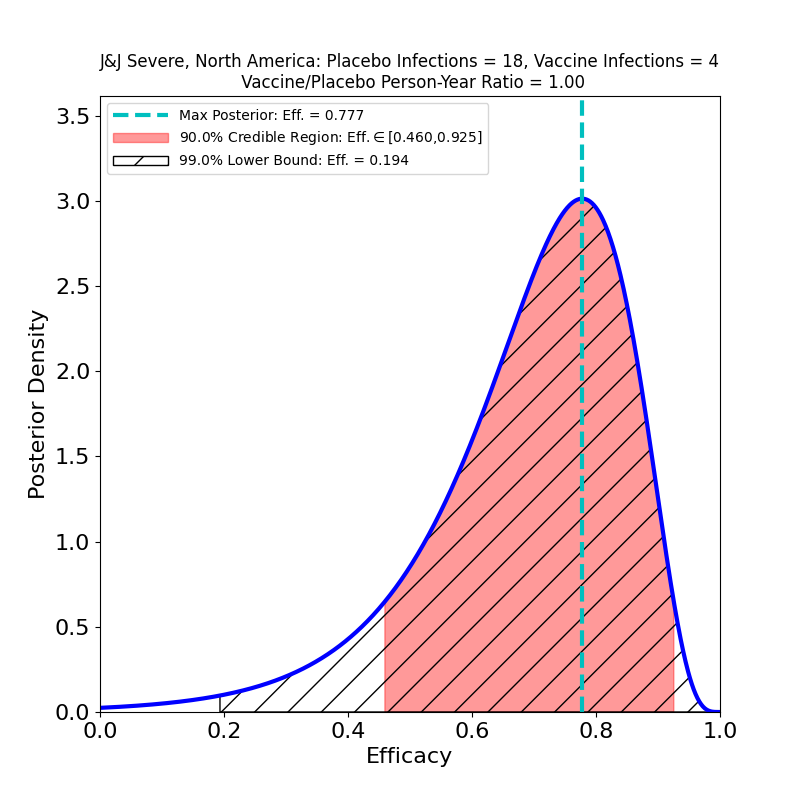
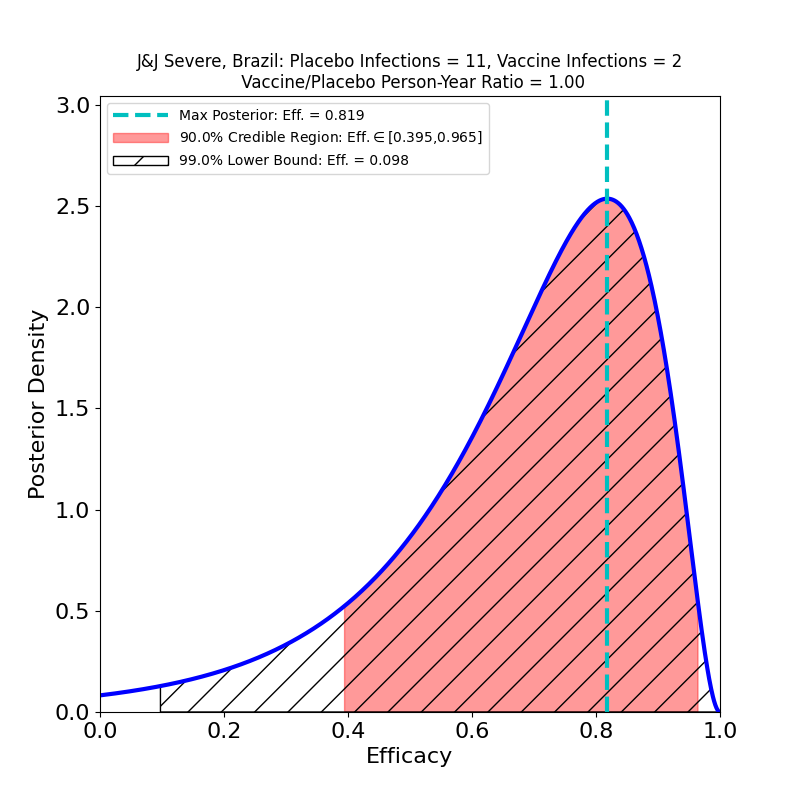
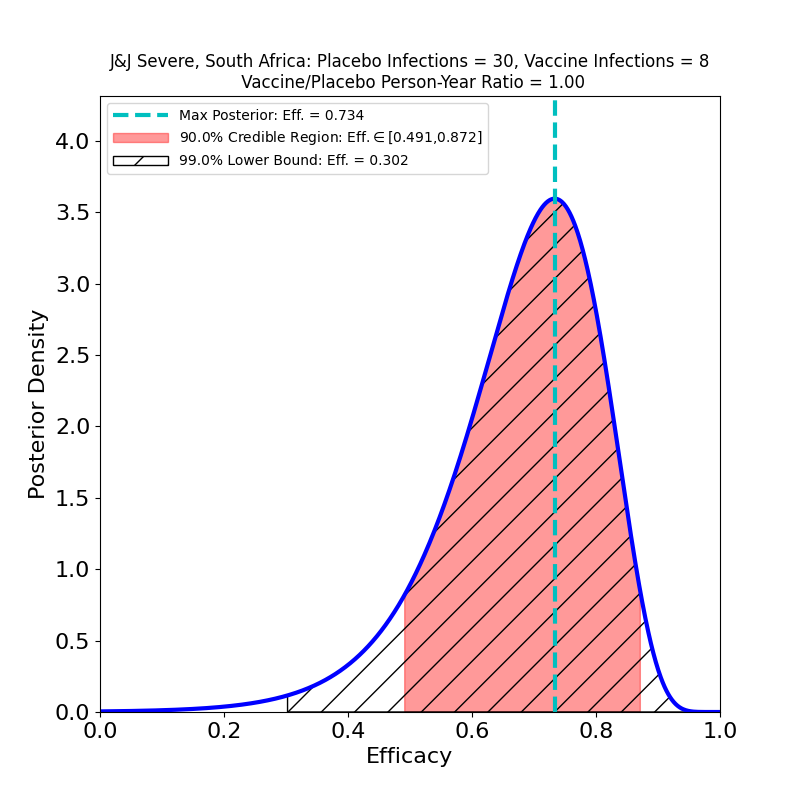
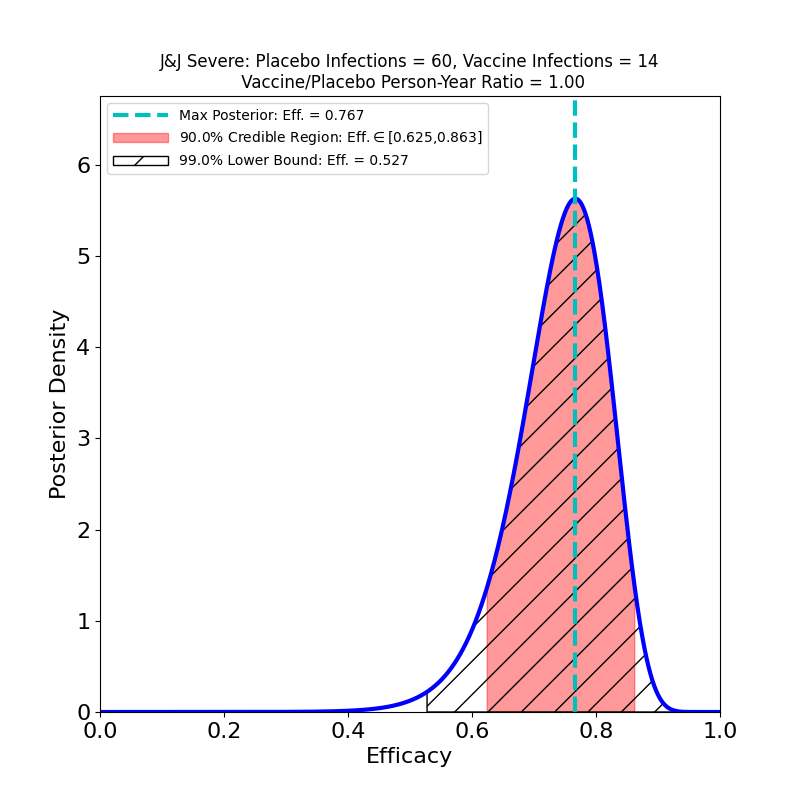
Country-by-country efficacy. Top left panel: USA; Top right panel Brazil; Lower left: panel; South Africa; Lower right panel: Overall (same as previous figure)
The news here is about variants, and it’s mixed. The efficacy is highest (74% peak value) in the USA, where the circulating variant is principally the Wuhan-H1 variant D614G (“classic” SARS-CoV-2), which was found in 96.4% of sequenced cases in the study.
In Brazil, where the study found a mix of P1 lineage (69.4%) and D614G (30.6%) the peak efficacy is a bit lower than in the USA (66%), but the wider curve (due to smaller numbers in the subgroup) shows that it’s quite possible that the efficacy in Brazil is the same as in the USA.
The bad news is from South Africa, where the B.1.351 variant constituted 94.5% of sequenced cases. Here the efficacy is clearly reduced (52% peak). The curve is wider, again due to lower subgroup numbers, so the actual efficacy could be a bit higher, but note that there’s more “pink” to the left of the peak than to the right. The area is proportional to probability, so unfortunately the smart bet would be that the actual efficacy is lower than 52%, rather than higher.
Now let’s take a look at protection against “Severe COVID-19”.
Protective efficacy against “Severe” COVID-19. Top left panel: USA; Top right panel: Brazil; Lower left panel: South Africa; Lower right panel: Overall
Here there’s some better news. The curves are all wider, because again the subset-of-a-subset numbers are lower, but there are some clearly improved trends. The efficacies are all systematically higher for the “Severe” disease sets than for “Moderate+Severe” sets. That is, in all countries, including South Africa, it appears that chances of contracting the severe form of the disease are appreciably lower for the vaccinated population. One should worry about the uncertainties due to low case numbers here, but again it is reassuring that in all cases the efficacy peaks move to higher values when only severe disease is counted.
It looks to me like a mixed-news situation. Protection against disease is clear except against the B.1.351 South African variant, and even here there seems at least to be reasonable protection against severe disease. On the other hand, protection against transmission (which is not technically evaluated in this study) is likely not great against B.1.351, since the vaccinated population will still have plenty of symptomatic virus-shedders, to say nothing of the asymptomatic cases.
To be fair to J&J, the Moderna and Pfizer/BioNTech vaccine trials did not confront variant subsets, so it is not possible to know with this kind of precision how badly affected their efficacies will be by the advent of B.1.351. Moreover, reportedly all the vaccine manufacturers believe that they can tweak their vaccines to target variants quickly, and the FDA has announced a speeded-up approval process for such re-tuned vaccines (similar to the annual flu vaccine approval process, which is highly streamlined).
My conclusion is that it is important to ship and jab as many doses as possible now, because one key factor in getting the epidemic under control is to stop the proliferation of variants, which appear in proportion to case numbers — the reason we’re suddenly beset by variants now, instead of in March, or August, is that case numbers during the winter wave eclipsed the cases in previous waves by a large factor. If we can get the cases down to the point that variants take much longer to develop, the vaccine-tuning process can control even the most transmissible variants. It’s a process, but there’s a good outcome at the end, I’m pretty sure.
This page is intended to collect in one place plots displaying the results of Bayesian analyses of vaccine efficacy, performed using the methodology described in this article. The data on which the analyses are based come from on-line sources — journal articles where available, but otherwise FDA briefing documents or even corporate press releases. I update or add plots whenever I become aware of newly-available data.
The code that makes these plots is written in Python, and is available from github.
A typical plot resulting from the analysis looks like this:
The plot displays the following analysis results:
A Bayesian posterior density — essentially a representation of how likely any particular value of the vaccine efficacy is — as a blue solid curve.
The maximum of the posterior density — the most likely value of the efficacy — is shown as a green vertical dashed line, and its value specified in the legend as the “Max. Posterior”.
A 90% credible region — a region that encloses the true efficacy with 90% probability — is displayed as a pinkish shaded region, and its boundaries are given in the legend as the “90% Credible Region”.
A 99% lower bound on efficacy is displayed as a hatched region — the lower bound is the left endpoint of the region, while its right endpoint is 1.0 (perfect efficacy). The value of the lower bound is given in the legend as the “99% Lower Bound”.
The plot title also gives the name/sponsor of the vaccine, the number of vaccine-group infections, the number of placebo-group infections, and the ratio of vaccine-to-placebo group person-times-at-risk (usually this is pretty close to the ratio of vaccine-group participants to placebo-group participants). These are the parameters that determine the results of the analysis.
An important thing about this type of visualization is that it allows easy assessment and comparison not only of vaccine efficacies, but also of the uncertainties that attend the efficacy estimates: If a posterior density curve is very broad, then the efficacy of the corresponding vaccine is known with less certainty than is that of another vaccine with a much narrower curve. The uncertainty can thus be understood at a glance. This uncertainty is a factor that is very rarely captured in media accounts of clinical trial results, but is really necessary to a realistic comparison of vaccine performance — one vaccine’s ‘”90%” efficacy may be less meaningful than another’s “90%”.
With very little practice, one can learn to read and interpret such plots, which in my opinion give highly intuitive representations of the constraints placed on efficacy by clinical trial data. Typically, more numerous participants and higher infection rates lead to more concentrated posterior densities — that is, to better-constrained, less uncertain inferences of efficacy value.
Each vaccine is typically associated with several analyses, corresponding to different clinical trial subgroups. For example, trial subjects who develop “severe” symptoms are often singled out, to ascertain a vaccine’s specific efficacy against severe COVID-19 (for the definition of “severe” one would typically have to carefully read the corresponding journal article, or its “supplementary materials” section).
Comments and corrections are welcome. I’m Carlo Graziani, a computational scientist at Argonne National Laboratory. My lab page is here.
Yesterday I updated the post on the Pfizer/BioNTech vaccine in light of a letter to NEJM by D. Skowronski and G. De Serres, in which they showed that in data from Pfizer’s submitted briefing to the FDA for Emergency Use Authorization there is information that can shed light on efficacy of a single dose of the vaccine. Go take a quick look at the post, then come back.
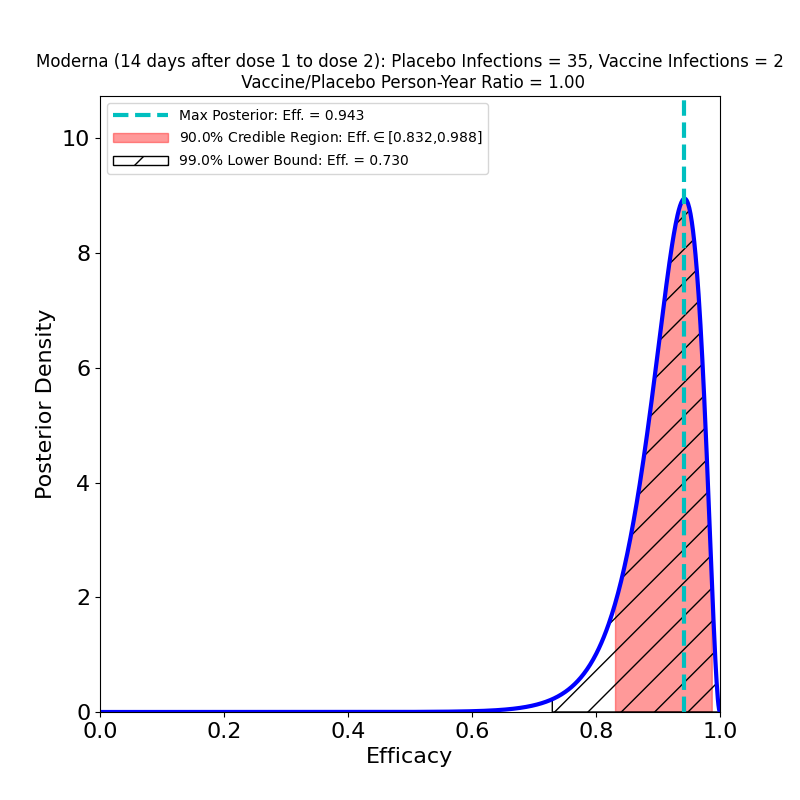
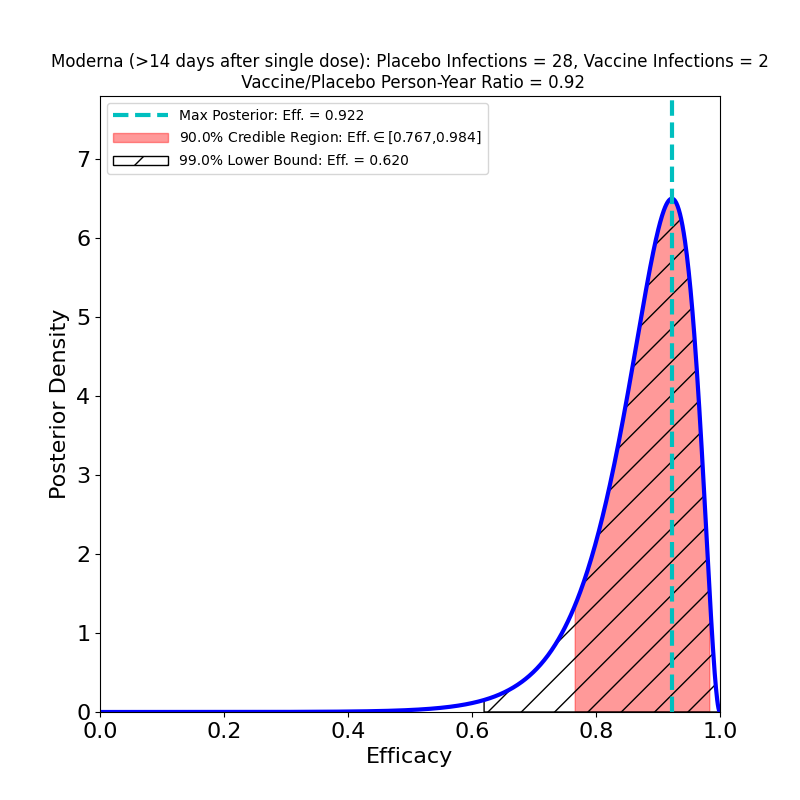
OK, it turns out that you can do the same cool hack on Moderna’s vaccine data. In the NEJM journal article describing the Moderna clinical trial, there’s a table in Figure 3 that lists cases 14 days after dose 1, but before dose 2 (2 in the vaccine group, 28 in the placebo group). Moreover, in Moderna’s EUA submission to the FDA, in Table 15 on p. 28, there’s data on trial subjects who only received 1 dose and contracted COVID-19 14 days or more after vaccination (2/983 in the vaccine group, 28/1059 in the placebo group). In our Bayesian setting, those data look like this:
Left: 2-dose trial participants who contracted COVID-19 after 14 days following dose 1, but before dose 2. Right: 1-dose “defectors” from the trial who contracted COVID-19 14 day or more following immunization. For an explanation of the features of this plot, seethis post.
So, it isn’t just the Pfizer/BioNTech vaccine that creates early immunity: the same is true of Moderna — in fact, the most likely value of the efficacy for the left-hand case (the 2-dose case) is the same as the final top-line value of 94%, whereas in the single-dose case on the right it’s “only” 90%, but the credible region is consistent with the final value, and it’s lower bound is a very respectable 77%!
The 1-dose participants form a less-controlled cohort. In particular, the briefing document notes that the follow-up time during which they were monitored was more heterogeneous (range 1-108 days, median 28 days). Nonetheless this data does extend quite a bit beyond the shot 1-shot 2 time interval, and appears to me to be stronger evidence that a delay of the second shot might be an acceptable choice in face of the vaccine scarcity crisis.
However, it is worth reading again what Aaron Esser-Kahn said in the Pfizer post: there’s a risk that needs to be taken seriously, which is that a weak immune response to immunization in a largish population could encourage viral selection — mutation of resistant variants. So it’s by no means an easy decision. I’m glad it’s not mine to make.
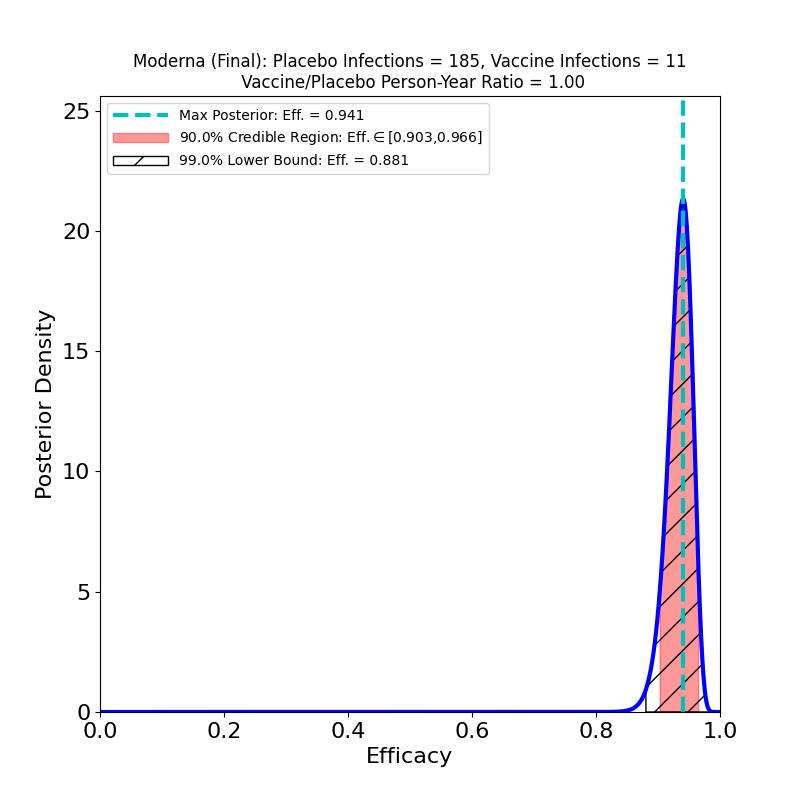
These plots result from the analysis of the Phase 3 trial data of Moderna’s 2-dose mRNA-based vaccine, reported in this article.
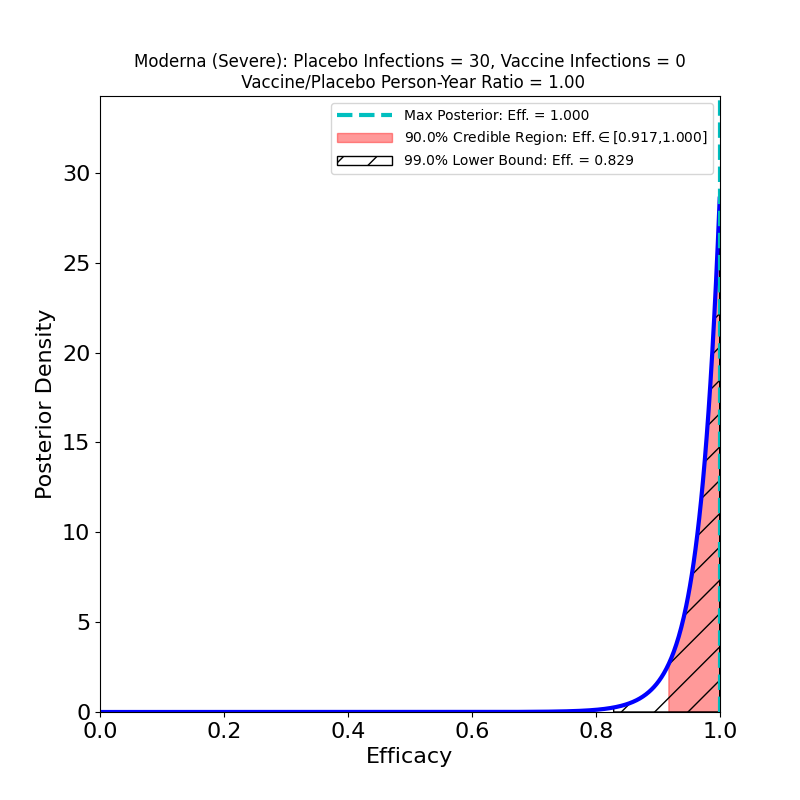
Left: Overall vaccine efficacy. Right: Efficacy against “severe” COVID-19.For an explanation of the features of these plots, see this post.
Moderna did a remarkable job of seeking out people with co-morbidities that put them at additional risk of contracting the disease. As a consequence, they wound up with 30 “severe” COVID-19 cases in their placebo group (and 0 in their vaccine group!), resulting in strong evidence of protective efficacy against severe COVID-19.
These plots result from the analysis of the Phase 3 trial data of Pfizer-BioNTech’s joint 2-dose mRNA-based vaccine, reported in this article.
Left: Overall efficacy. Right: Efficacy against “severe” COVID-19.For an explanation of the features of these plots, see this post.
Pfizer-BioNTech’s overall vaccine efficacy seems entirely comparable to Moderna’s. Interestingly, Pfizer-BioNTech’s “severe” protective efficacy seems rather disappointing, compared to Moderna’s. Note that this result does not show that Pfizer’s vaccine has lower efficacy against the severe disease than Moderna’s — only that Pfizer collected much worse evidence about severe disease efficacy than Moderna did. Pfizer only had 9 severe cases in its placebo group, as opposed to Moderna’s 30. This indicates that Pfizer was less diligent in recruiting trial participants with co-morbidities associated with the severe disease. In fact, the efficacy against severe disease could be the same as Moderna’s (why wouldn’t it be? the vaccines are very similar…), but Pfizer didn’t design their Phase 3 study in such a way to establish this.
Update, 17 February 2021: In a letter to NEJM, D. Skowronski and G. De Serres drill down into the Pfizer data released to the FDA, extracting cases occurring between the first and second shot. They found something remarkable about the cases 14 days or more after shot 1, but before shot 2:
Efficacy inferred from cases in the Pfizer phase 3 clinical trial, occurring before shot 2 but more than 14 days after shot 1.
It turns out that this vaccine’s most likely efficacy after a single shot is 92%, not that different from the top-line efficacy number, and the 90% credible region is bounded below at 78%. The authors actually cite a 95% confidence interval (this is technically different from the credible regions reported on this site) as bounded below at 69%, a bit more conservative, but not inconsistent with the Bayesian result.
This is remarkable, but not that surprising. If you look at the now-famous Figure 13 of the Pfizer submission’s briefing document to the FDA, you can clearly see that by day 14 substantial protective efficacy has taken hold. There are better ways to analyze the uptake of efficacy than cutting the data in this way, but only if the Pfizer team were to release the full data for Figure 13. As it stands, Skowronski and De Serres have made an important discovery on the basis of a clever hack of the released data.
Their letter asserts that this evidence justifies delaying the second dose, so as to make early vaccinations available to more people. It’s a serious argument. I don’t feel qualified to assess its strength, although it does seem worth pointing out that this kind of data cannot speak to whether the protective efficacy of a 1-dose schedule declines faster than that from a 2-dose schedule, since all this data is from a short period after the first dose. In a pandemic-driven vaccination scarcity crisis, it may be worth taking the risk, or it may not. At a minimum I would say that the FDA has good general reasons not to support deviations from the only schedule that has been tested in an actual clinical trial. Exceptions should be extremely rare, and justified by extreme circumstances.
Update, 18 February 2021: Aaron Esser-Kahn (University of Chicago) shared the following with me, which I think is helpful to thinking about vaccine schedule changes:
I do think these arguments about 2nd dose delay are very complicated and not always appreciated by those not familiar with the complexity of the immune response . On first pass its very exciting that it protects, but what can’t be known without further experiment are the following (1) how long does it protect for? (2) Do the antibodies and cellular responses decrease rapidly? (3) What does the antibody and cellular selection look like? While I completely agree that a 3 week boost is arbitrary (having arbitrarily made this decision many times myself, I know it’s arbitrary), there are important considerations about the window in which B-Cell and T-cell selection are happening. Too long and you will get different cells and antibodies out. This could have longer term effects. So its always a questions of the devil you know vs. the one you don’t. One major risk you run is generating sub-optimal responses that allow viral selection in vaccinated individuals with weaker responses.
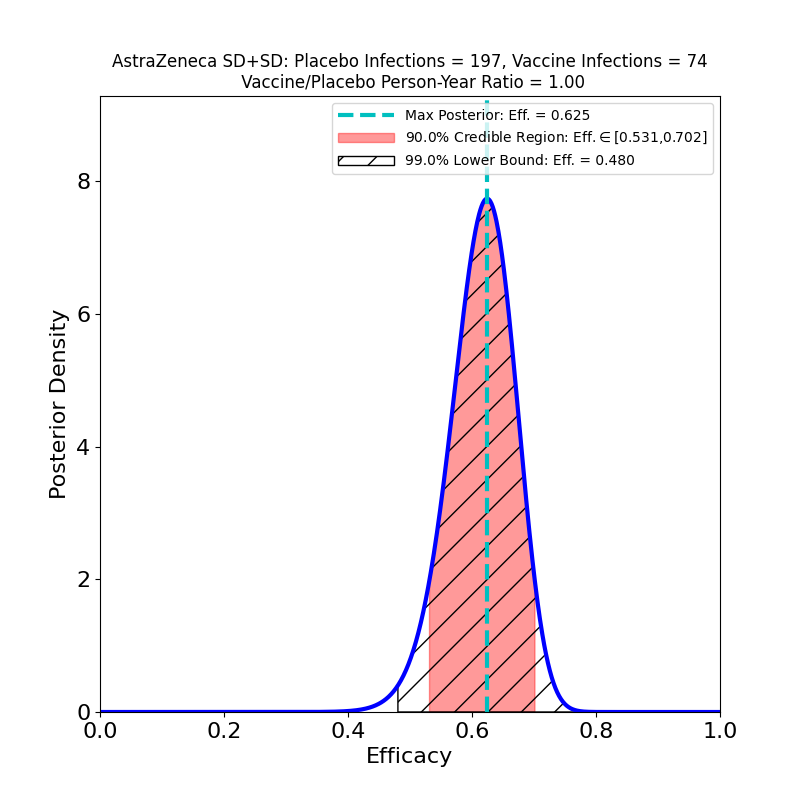
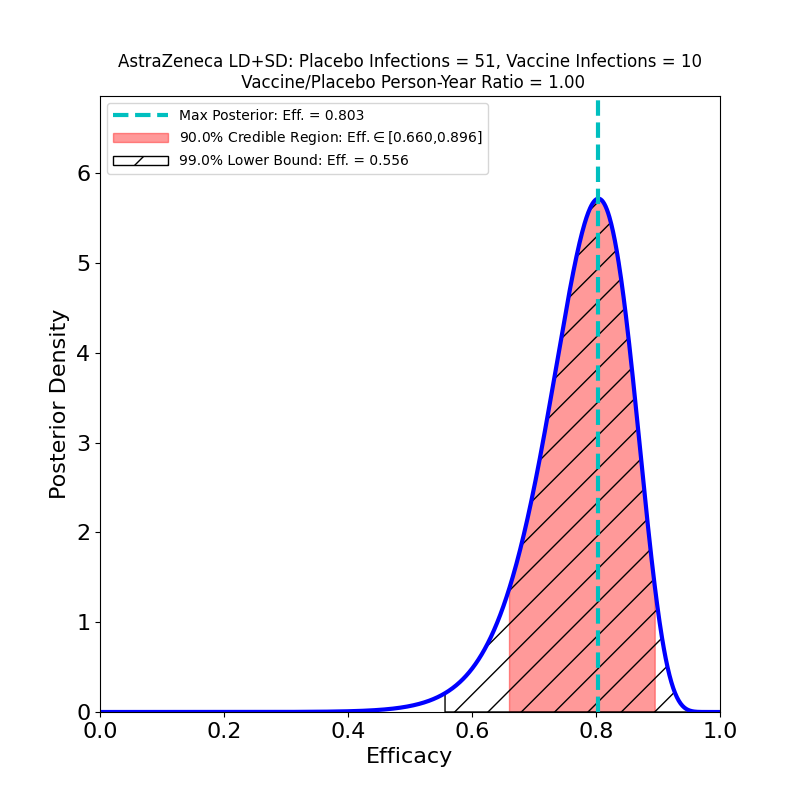
These plots result from the analysis of the Phase 3 trials of AZ’s 2-dose adenovirus-based vaccine, reported in this article. Note that AZ kind of botched this trial, administering the wrong 1st dose (50% of planned standard dose) to a subset of participants. In so doing they stumbled into a serendipitous discovery: the efficacy of a low-dose followed by a standard-dose booster is higher than the efficacy of the originally-planned two-standard-dose vaccination.
Left: Two standard-dose vaccination (“SD+SD”). Right: Low dose followed by standard dose (“LD+SD”). For an explanation of the features of these plots, seethis post.
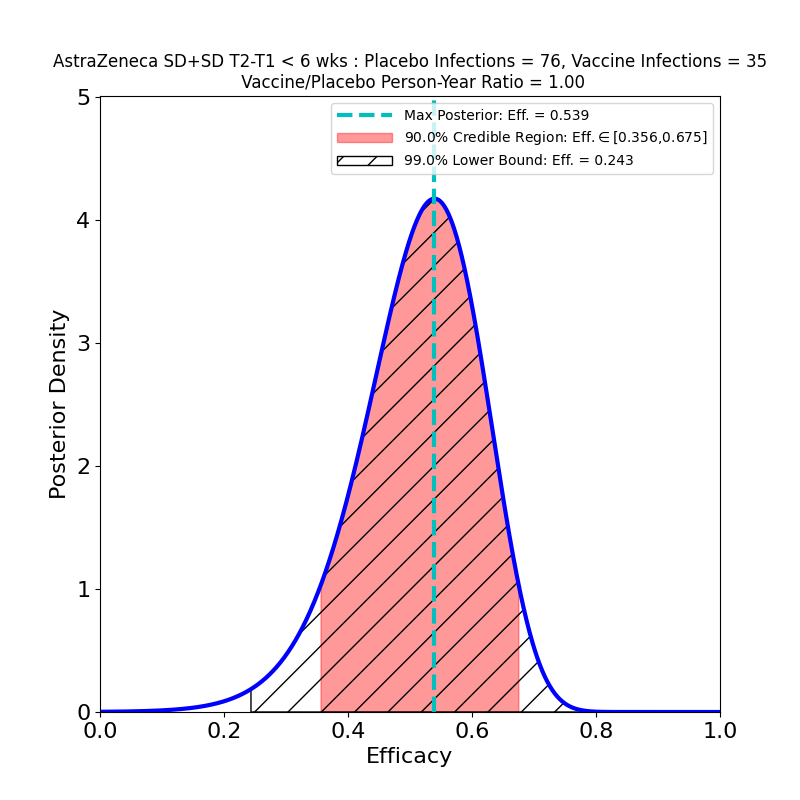
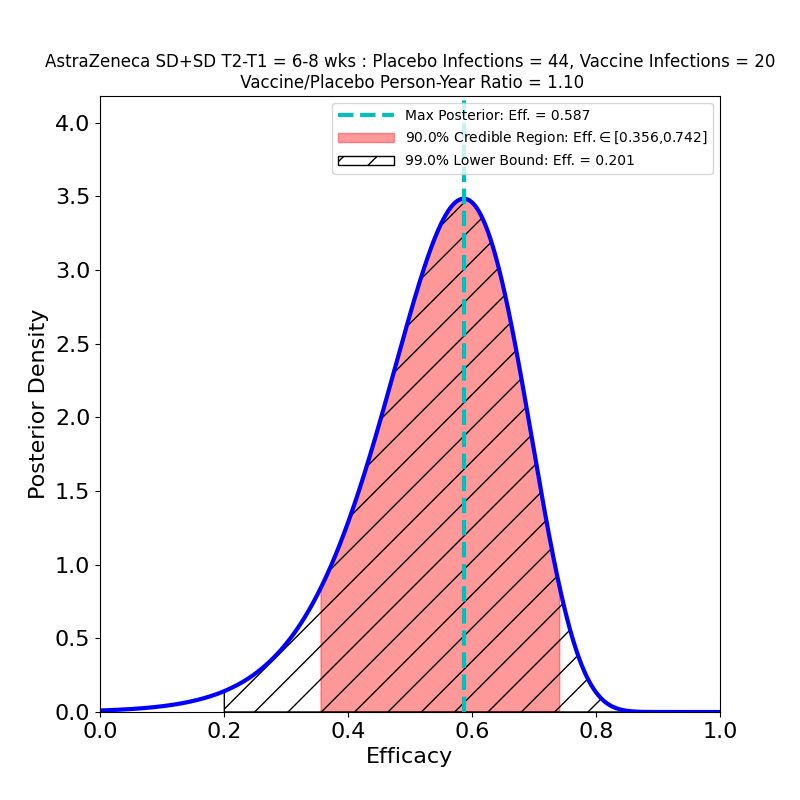
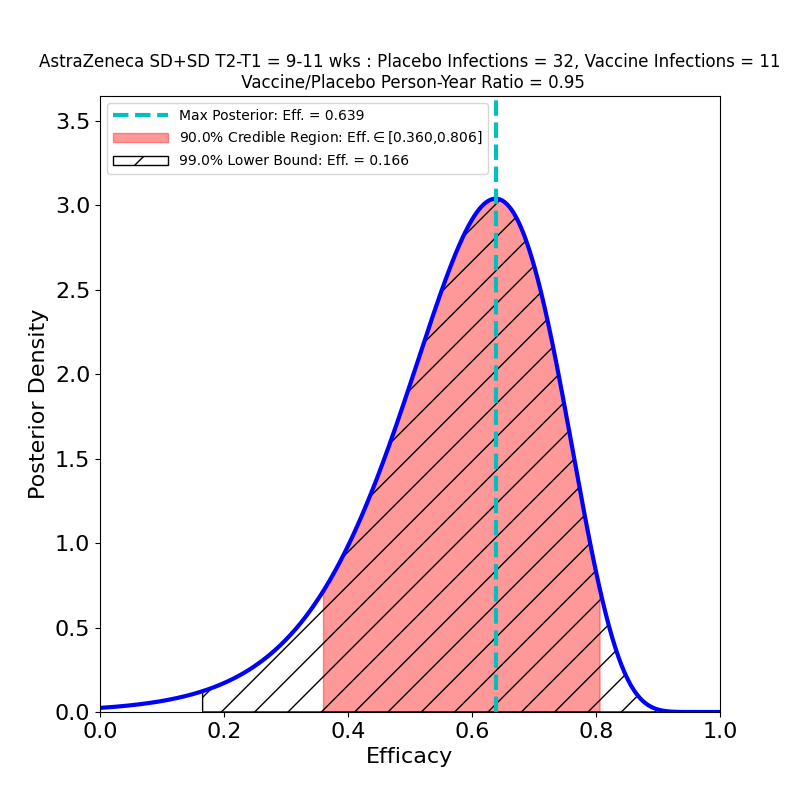
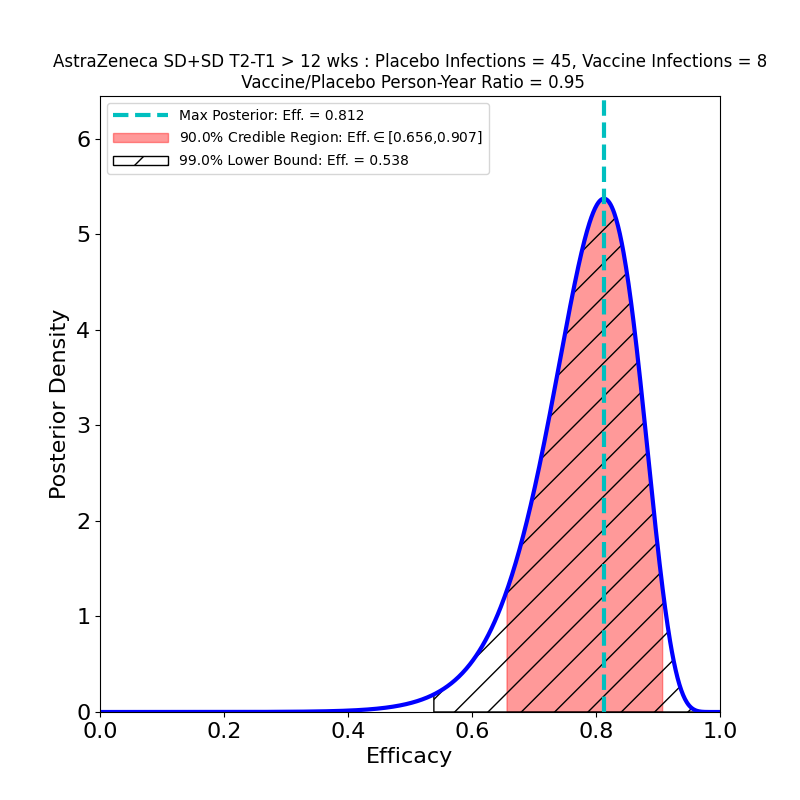
The overall story for SD+SD is not as bad as it appears, however. The authors broke out the numbers by time elapsed between shot 1 and shot 2. Again, it seems like a strange study “design” that this parameter should be a variable, and suggests a rather improvised design. The authors of the article assert that this variability in dose schedule was due to manufacturing delays. Once again they succeeded in making lemonade from lemons, as this feature of the clinical study allowed them to see the evolution of efficacy with booster shot delay time:
These plots are for protective efficacy against “symptomatic” COVID-19. One can clearly see a progression here, with efficacy growing as the time-delay of the booster shot increases, and with final efficacy comparable to the “LD+SD” results above.
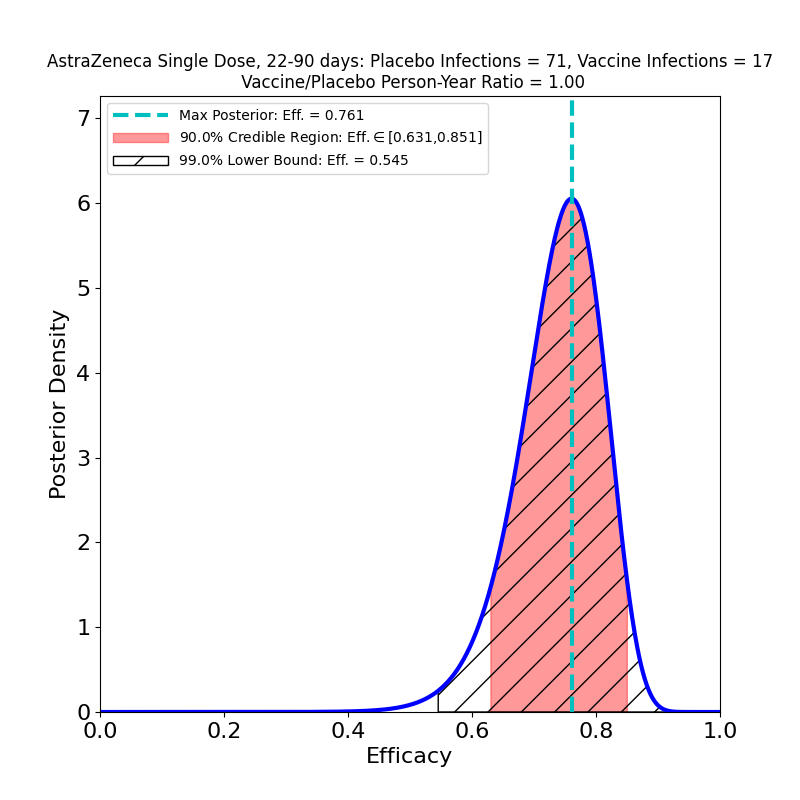
The article also reports “single-shot” data from study subjects who declined to have a second shot after having received the first shot (at standard dosage, i.e. “SD”). The data for all symptomatic COVID-19 cases diagnosed 22-90 days post-vaccination of such single-dose study subjects yields the following results:
Single-Dose (SD) Efficacy, 22-90 days post vaccination.
A comparison with the “LD+SD” plot above suggests that the protective immunity of the vaccine is about the same — the peak efficacies are close (0.761 vs. 0.803), and the 90% credible regions overlap quite a bit. A comparison with the lower-right panel of the previous figure (SD+SD, booster shot delay > 12 weeks) leads to a similar conclusion — there’s little to choose from between a single SD shot or an SD+SD schedule separated by 12 weeks!
It’s a bit puzzling to sort out all this. Apparently LD+SD, SD+SD spaced out by 12 weeks or more, or a single SD dose all yield about the same efficacy, while SD followed by an SD booster with an insufficient delay actually lowers the protective efficacy of this vaccine with respect to what it would be if the booster were simply omitted!
This is the oddest study of a vaccine that I’ve seen so far. It’s a relief that the evidence for strong efficacy is so clear, of course. But there are serious scientific questions raised by these results that will certainly require further investigation.
And, AZ needs to raise its standards for conducting clinical trials.
Update, 5 February 2021: A preprint appeared today in The Lancet showing the results of the vaccine trials broken out by virus variant — the B.1.1.7 variant whose prevalence in the UK is increasing (and which has a higher R0 than the “classic” virus strains, see Figure 1b of this paper). The authors sequenced swabs from study participants to separate the B.1.1.7 infections from other infections. Table 1 of the new preprint has the data. The “symptomatic” case data leads to the following Bayesian analysis output:
Left: Study subjects with B.1.1.7 variant infections. Right: Study subjects infected with other strains.
These data combine both SD+SD and LD+SD cases. On the basis of these plots I would have to say that the claims in the media of the vaccine’s equivalent efficacy against the B.1.1.7 strain are a bit too enthusiastic. The claim is based on a comparison of the most likely efficacy values (74% vs 84%), but takes no account of the uncertainty due to the small sample. Note that according to the 90% credible region the efficacy against B.1.1.7 could be as low as 48%. It is almost certainly higher than that, but note that the probability distribution in the left panel of the figure has considerably more mass to the left of the peak than to its right, meaning that the actual efficacy is quite likely to be lower than 74%.
In fact, the preprint cites a 95% confidence interval (technically a different measure of uncertainty from the credible regions given on this site) of [41.6%,88.9%], so the authors are — as expected — diligent about reporting the uncertainty in the result. It’s unfortunate that these caveats get lost in media reports, however, because on present evidence we should be prepared for the possibility that the AZ vaccine (and other vaccines as well) will be found to have much lower efficacy against B.1.1.7 and other strains — compare the case of the Novavax vaccine.
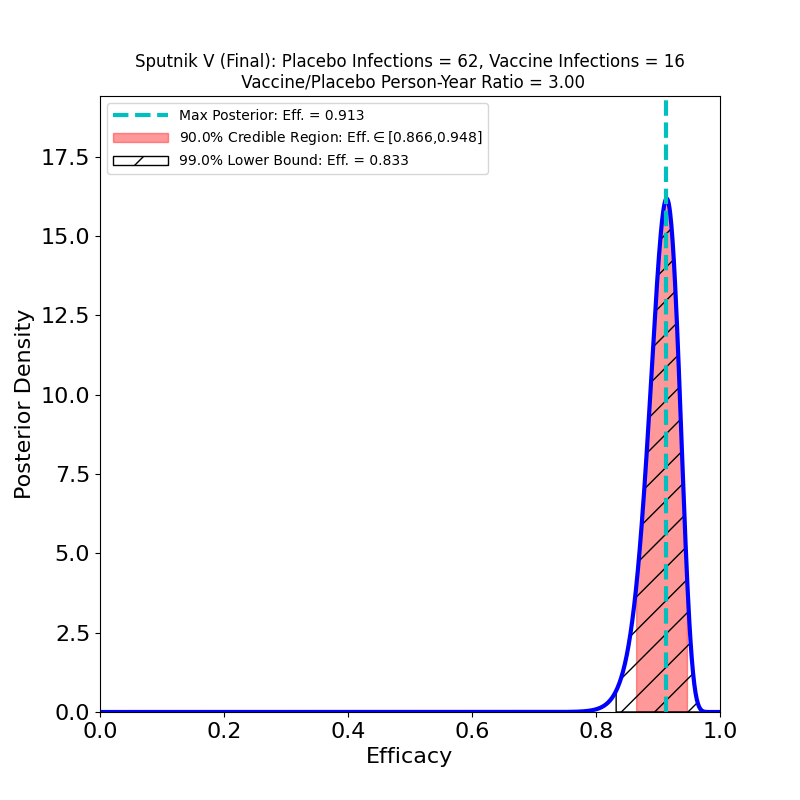
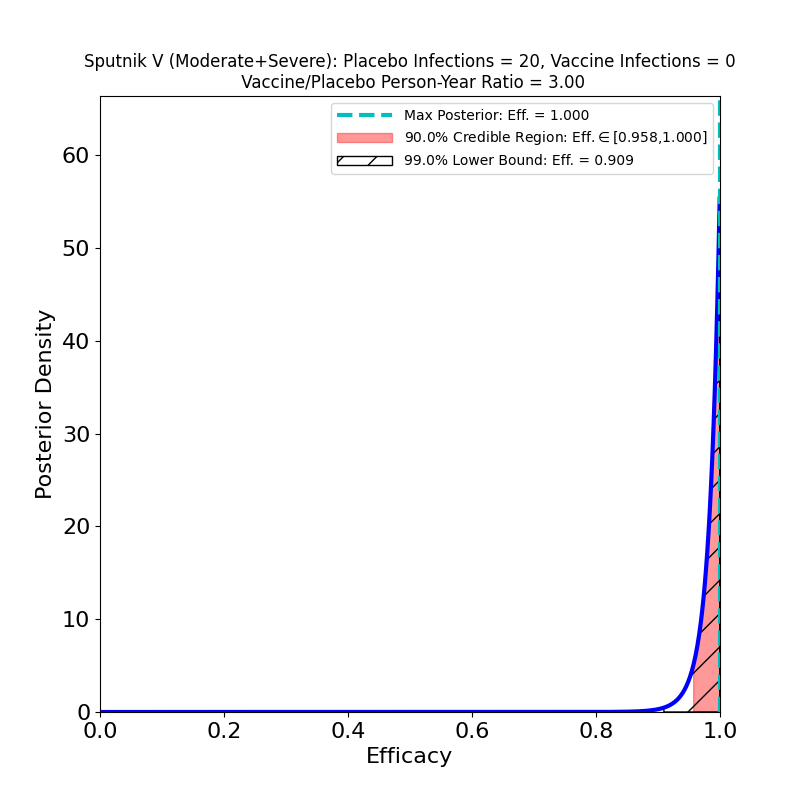
This is an adenovirus-vector vaccine with a 2-dose schedule — the two doses use different adenoviruses “…to overcome any pre-existing adenovirus immunity in the population.” The Phase 3 results are reported in this article. One clever thing about this study is that the placebo group is only 1/3 the size of the vaccine group, which should increase the sensitivity of the study to the efficacy signal, assuming sufficient placebo infections occur (not a difficulty in a raging epidemic :-( ).
Left: Overall efficacy. Right: Efficacy against “moderate and severe” COVID-19.For an explanation of the features of these plots, seethis post.
The overall efficacy appears to be very good — a bit lower than Moderna’s and Pfizer’s vaccines, but higher than AstraZeneca’s vaccine. Since AZ’s vaccine is also adenovirus-mediated, it is interesting to compare the two. Oddly, Sputnik V obtains its efficacy without a reduced first dose, despite AZ’s reduced efficacy with two standard doses. Perhaps the dual adenovirus vector helps avoid the pitfall that befalls the SD-SD case in AZ’s study.
Also, the protection against “moderate + severe” symptoms is clearly excellent. The clever choice of placebo-to-vaccine group size really helps here. There are 20 “moderate+severe” cases, which is fewer than the 30 in Moderna’s study, but the power of those cases is amplified by the study design, so that the posterior density of the Sputnik V “moderate+severe” cases is more concentrated than is the case for the Moderna “severe” cases.
I would caution that it is difficult to compare different vaccines for this kind of protection, as the subset definitions of “severe”, “moderate” etc. are completely study-dependent. One would really have to read the journal articles carefully to understand the extent to which these categories can be compared across studies. I don’t feel qualified to do this myself, so I’ll just issue the caveat.
These plots result from the data reported in a Novavax corporate press release issued on 28 January 2021. I’ll update them if more detailed and/or authoritative information becomes available.
Novavax reported results from two clinical trials: a Phase 3 trial performed in the UK, and a Phase 2b trial performed in South Africa. The press release does not state the dose schedule, but from information at clinicaltrials.gov here and here it appears to be a 2-dose schedule, with doses 21 days apart. The South African trial was performed under conditions of high prevalence of a new variant of the SARS-CoV-2 variant. Here are the plots:
Right: Phase 3 study performed in the UK. Left: Phase 2b study performed in South Africa, with high prevalence of a new SARS-CoV-2 variant.For an explanation of the features of these plots, seethis post.
In the UK, against SARS-CoV-2 “classic”, the efficacy is as impressive as the other principal vaccines (e.g. Moderna, Pfizer/BioNTech, AstraZeneca, Sputnik V). The peak at 89% is certainly very encouraging news.
The South African trial results are worrisome, however. The numbers are still small (this is a Phase 2 trial), but the peak efficacy against the South African variant is below 50%. It is not clear to me why the press release claims that 15 vaccine cases and 29 placebo cases results in an effectiveness estimate of “60%”, unless they chose a larger size for the vaccine group than for the placebo group — the press release doesn’t contain the necessary detail. I’ll be revisiting this one when the company submits a briefing document to the FDA EUA committee, or when they publish a journal article.
In any event, it seems clear that (a) the efficacy against the South African variant is considerably lower than against the “classic” SARS-CoV-2, and (b) the study numbers are not yet large enough to ascertain how much lower — the 90% credible region goes from 69% (only a little lower than the UK estimate) to 15% (basically useless). It seems clear that this vaccine — and probably all the other ones — will have to be updated soon to fight new variants.
Updated 5 February 2021: Dan, in the comments, points out that the 60% efficacy claimed in the press release corresponds to efficacy in HIV-negative participants. I should learn to read the nuances in press releases more carefully…
The “data” for these plots is obtained from a Johnson & Johnson corporate press release issued on 29 January 2021. The release is actually not that informative — among other things, it doesn’t state explicitly the number of vaccine-group and placebo-group infections in the clinical trial, or for any of its subgroups. We have to wait either for a briefing document submitted to an FDA EUA committe, or a published journal article.
Update (5 Feb. 2021): The FDA has announced that the EUA committee will meet on 26 February 2021, and that background materials will be made available to the public “no later than two business days prior to the meeting”. So it should be possible to update this post with real data on or about 24 February.
Update (25 Feb. 2021): The EUA briefing is now available, so this post is not the best place to read about this vaccine. See this post instead.
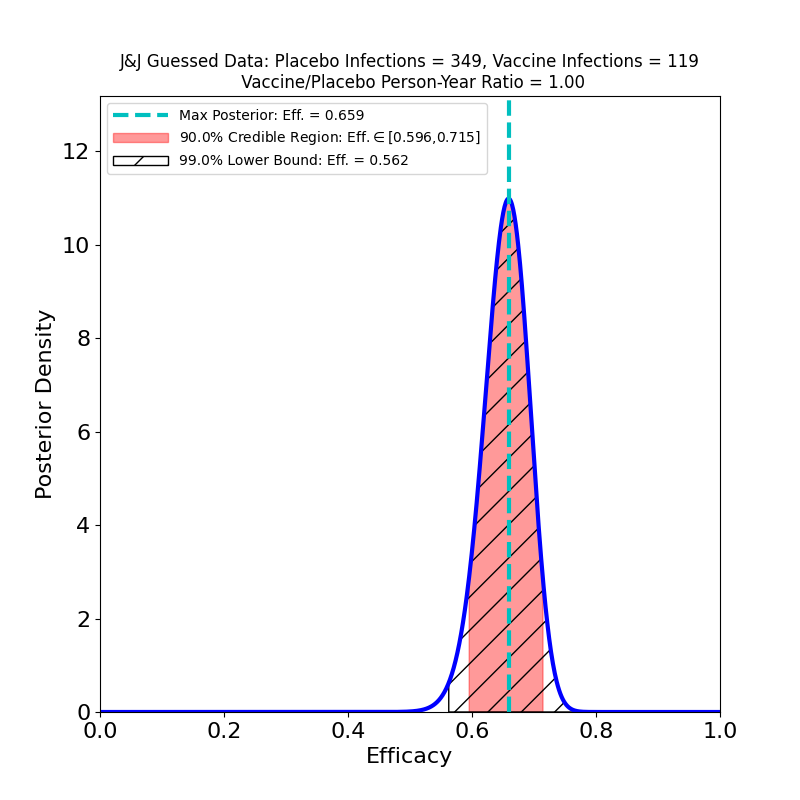
On the other hand, it is possible to guess one pair of numbers from the press release, even if they are not stated explicitly. The release states that 468 symptomatic cases of COVID-19 were observed overall, and that the overall efficacy inferred from this is 66%. From this, with a very little algebra, we can surmise that the number of vaccine cases was 119 and the number of placebo cases was 349, assuming the placebo and vaccine groups were the same size.
We therefore tentatively have this analysis:
Johnson & Johnson/Janssen efficacy analysis using data guessed from information in the J&J press release.For an explanation of the features of this plot, seethis post.
The peak is at 66% (by construction, since this is how I guessed the data). The vaccine looks quite effective — not as spectacular as some of the other vaccine topline results, but certainly enough to be effective in a vaccination campaign. The trial was conducted over North and South America, as well as in South Africa, so it is quite likely that this analysis mingles different efficacies due to the emergence of different variants in different regions — compare the results reported by Novavax for their vaccine.
The following plot results from interim data disclosed at a press conference and reported by The New York Times. The data is from a subset of a Phase 3 clinical trial in progress in Turkey. My thanks to Kyle Felker (Argonne National Lab), who spotted the data.
Efficacy inferred using preliminary data from a clinical trial of the Sinovac CoronaVac vaccine in progress in Turkey. For an explanation of the features of this plot, seethis post.
The analysis looks encouraging, with a peak-posterior efficacy of 91%. With these small numbers, that efficacy is not particularly well-constrained, however, as can be seen from the plot — the lower bound of the 90% credible region is 0.77, and the 99% lower bound is 0.65. This kind of spread is to be expected for an interim result, and hopefully the results will firm up soon with disclosure of the full clinical trial results.