The Magic Of RT-PCR
It’s not being fooled. RT-PCR is doing exactly what it’s being asked to do. We are using it foolishly.
Let’s briefly and schematically review what the assay does (the review will perforce have to be schematic: I am not a laboratory person, but rather the kind of person who warrants watchful supervision when allowed inside a lab, and must be strictly kept from touching anything, lest some portion of the local neighborhood require evacuation). A specimen collected from a swab is biochemically treated so that if any SARS-CoV-2 virus is present, in concentrations however small, then a carefully-chosen stretch of the virus’ RNA will be isolated from the rest of the goop in the swab, and coupled to other biochemical agents, including one that emits a bit of fluorescent light. Then something spectacular, yet somehow nowadays routine happens: this carefully prepared payload is put through a biochemical cycle that doubles the concentration of payload packets. This also, incidentally, doubles the emitted fluorescent light. The cycle then repeats, doubling the packets again. You get the idea, it’s an exponential progression, with a doubling of concentration at every cycle, and a concomitant doubling of fluorescent light intensity (the “CR” in “PCR” stands for “Chain Reaction”, remember where that term is from?) Eventually, the light signal becomes bright enough to be detected above some threshold. The number of cycles required to attain this threshold is called the “Ct” (“Cycle-Threshold”) measure. Ct essentially a negative-logarithmic measure of viral load—the lower Ct, the fewer cycles necessary to see the fluorescence, the higher the viral load in the initial sample must have been.
By convention, if a fluorescent signal has not been measured above threshold by the 40th cycle, the assay is declared “Negative” for the genetic material of the virus being tested (and hence, the patient is “Negative” for COVID-19). On the other hand, if the signal is detected, the patient is “Positive”.
Notice something missing? The assay actually measured viral load, but the test result omits stating what the viral load is! In most places in the world, the result of an RT-PCR test is a “Positive” or a “Negative”, but reporting actual Ct values is very unusual (a friend of mine had one from a lab test in Mexico, though). One rarely even gets a range (e.g. “High load”, “Medium Load”, “Low Load”).
So now I can finally start to tell you what this essay is really about. In my opinion, the decision to withhold Ct data has had catastrophic consequences for our ability to perform surveillance of, and anticipate changes in the COVID-19 pandemic. Catastrophic. As in, we’re flying blind, at tree-top level, with a perfectly usable window nailed shut for no reason. I realize this is strong language, so let’s see what evidence there is to back it up.
How Could Data Scientists Use Ct Values?
I’ve heard a few explanations for why labs, hospitals, and doctors might be reluctant to traffic in Ct values and viral loads. To begin with, Ct is apparently not easy to work with as a clinical diagnostic measure, I’ve been told. Also, a respected biostatistician that I know feels that it wouldn’t be useful to have aggregated Ct values the way we have aggregated positive test statistics, because it is very difficult to cross-calibrate different RT-PCR machines. This is certainly true. COVID-19 testing facilities are not biochemistry discovery labs, but rather mass processing facilities, and the standards for calibration are much less exacting than in a science lab. The same Ct value, registered on different machines, could correspond to a discrepancy of a factor of hundreds in concentration, according to my biostatistician friend. He regards this as a fatal flaw in that datatype.
I am personally incredulous that this argument could be taken seriously in 2021. In the first place, concentrations are logarithmic quantities, and SARS-CoV-2 concentrations, in particular, typically span an enormous range. A “Low” Ct (i.e. a “high” viral load) is typically about 12, and the threshold is 40. That’s a range of 28 doublings, corresponding to a factor of 268 million, roughly in the ratio between the highest known and lowest detectable concentrations. So why are we arguing about a confounding smearing factor of about 100? That’s ridiculous. If we had a histogram of Ct values, with certain structures in the histograms that we were attempting to understand, machine miscalibration effects would smear the structures a bit, so that a “peak” of width 1 in Ct-space would be observed to have width 6-7 or so instead. But if we could have histograms with millions of data points per day, why should we care?
Last fall, my colleagues Ben Blaiszik, Jim Olds, Ian Foster, and I wrote a paper on the use of aggregated RT-PCR positives data, broken out by vaccination status, to estimate vaccine protective effectiveness (VE). One of the things that we demonstrated is that even with only a small number of US State and local public health authorities making this kind of data available, the resulting data rate is huge, positively dwarfing the kinds of data rates available to typical controlled studies of VE, and as a consequence we had, in effect, a high-resolution epidemic surveillance microscope on the effect of the advent of the Delta variant on VE, with time resolution of a week (as opposed to a more typical figure of three months or so), and a geographic resolution of a US county (as opposed to, say Qatar, or Scotland). We were able to produce plots such as these:
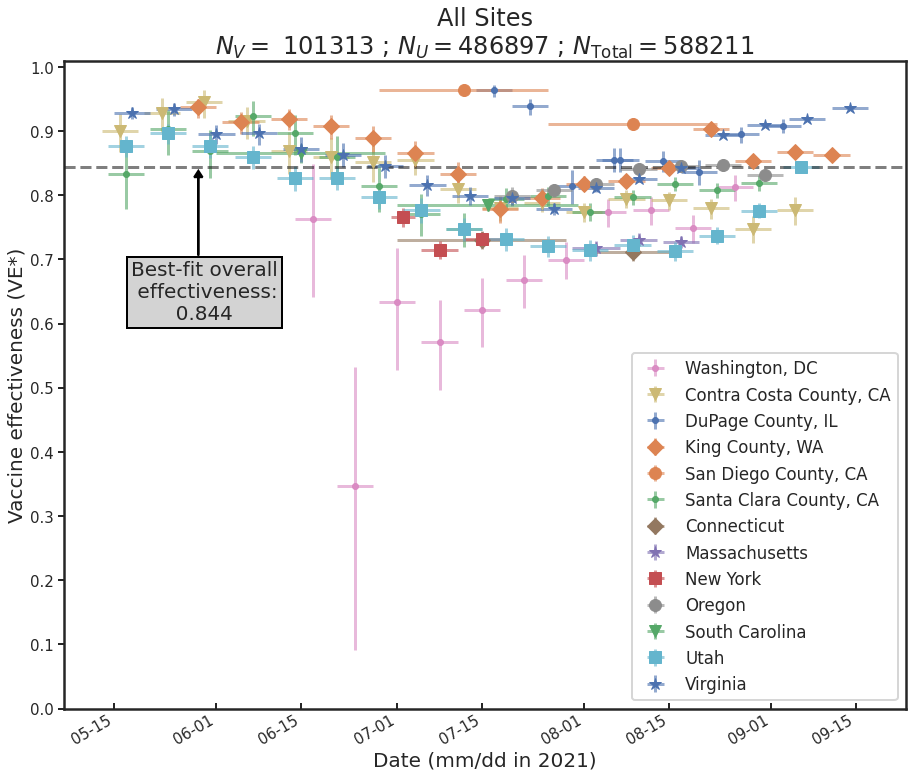
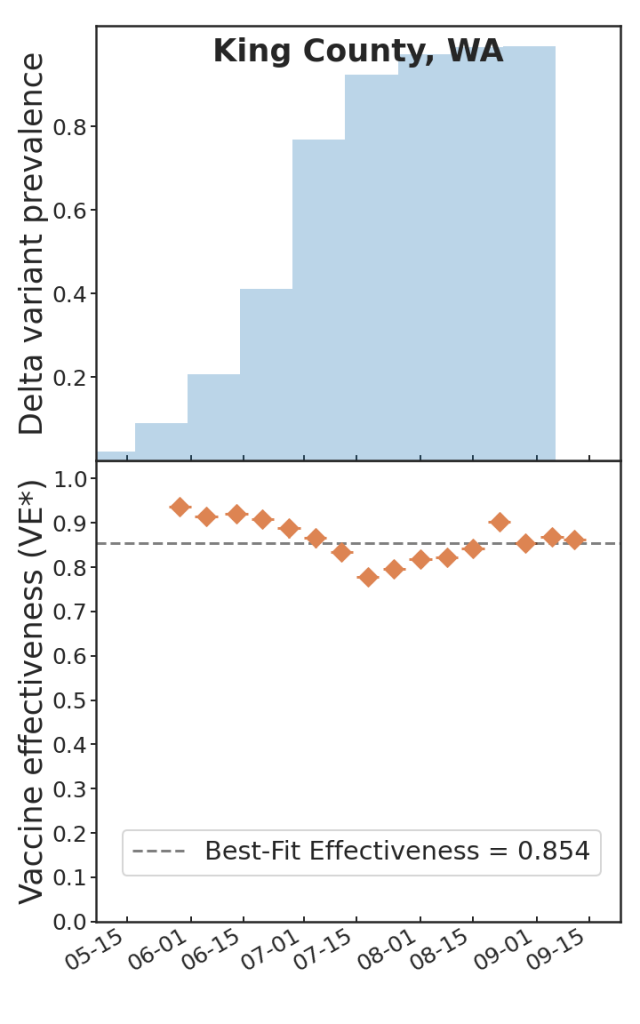
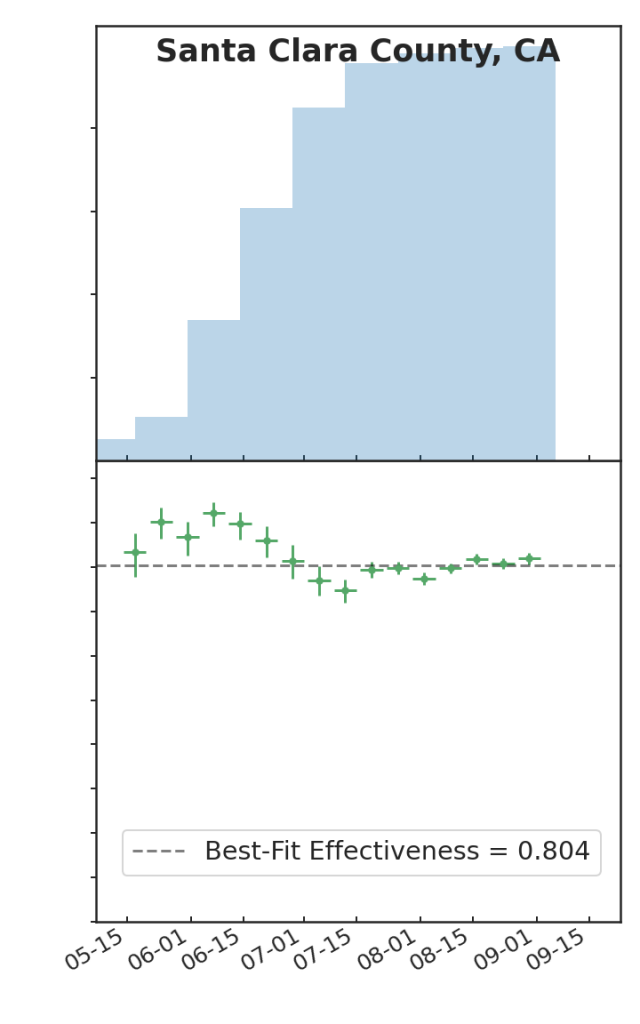
Which is to say, we found that there is tremendous, barely-exploited potential for epidemic surveillance in run-of-the-mill swab data. At a time when there was a lot of panic and confusion over the implications of the advent of Delta for the protectiveness of COVID-19 vaccines, it was possible already by August 2021 to see in the data—again, RT-PCR positive data, broken out by vaccination status (vaxxed versus unvaxxed)—that Delta was not, in fact having much of an effect on VE, and that most of the observed variations in VE were due to demographic effects: changes in the compositions of the vaxxed versus unvaxxed cohorts (e.g. vaccinate a lot of old people and VE goes down, because you transfer a lot of infection risk out of the unvaxxed cohort into the vaxxed cohort; vaccinate a lot of 12-17 year olds, as happened in the USA after the FDA approved youth vaccination in May 2020, and VE goes up, because that group has relatively lower infection risk, and that lower risk is now owned by the vaxxed cohort; and so on).
The trouble with this kind of approach is that it is a time-series approach, and as I pointed out in my last post, in connection with genomic surveillance, time-series take time to observe. Recall that this was the advantage of looking for the genomic signature of co-infection, rather than waiting to observe the failure of a new variant to drive out an old one, when looking for signs that a true Type 1 breakthrough-capable escape variant has appeared: you get the co-infection signal immediately, rather than having to wait for weeks that would be put to better use getting ready for the coming tsunami.
The same is true here. And my point is that Ct, in this case, plays an analogous role to rapid whole-genome sequencing: if “Ct-with-every-positive-test” were available, it would permit us to short-circuit the long, painful wait for the time-series to delineate themselves, and permit real high-quality epidemic surveillance conclusions in near real time.
Here is an example of how that might work. Suppose a new variant emerges, and the question is “how badly is vaccine-primed immunity impacted?” There isn’t much time to find out: Delta emerged in India in January 2021, arrived in the USA by late April, and owned the entire US genomic landscape of SARS-CoV-2 by mid-August. Omicron moves about 5-6 times faster than that. So, answers NOW! What could we do?
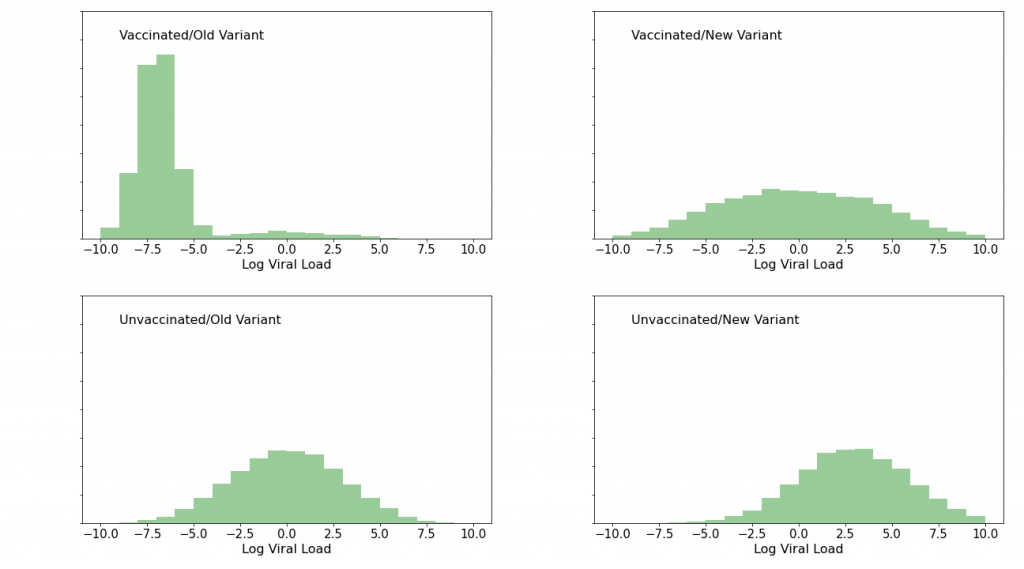
Well, vast numbers of people are donating snot to RT-PCR assays every day, in every region of the world. Tens of thousands per day in the region where the new variant just popped up, and millions elsewhere. Suppose we had a Ct values for every positive result, and suppose we know (a) vaccination status, and (b) SARS-CoV-2 genome (i.e. new variant or old variant). In short order, we’d have enough data to cut into 4 quadrants: Vax+Old, Vax+New, Unvax+Old, Unvax+New, and histogram the 4 quadrants. Suppose that we were to see the following (totally made up!) data:
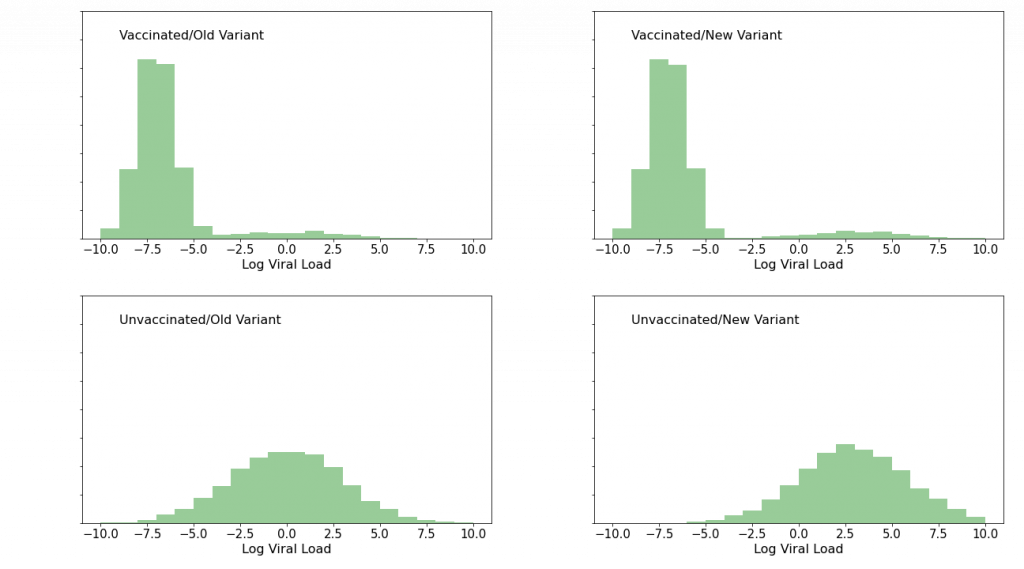
The upper, “vaccinated” histograms show a low viral load peak, representing “failed infection” or alternatively “doomed infection being successfully fought off”, as well as a low foothill to the right, representing full-up Type 2 (“statistical”) breakthrough infections which we know ought to be present because vaccine efficacy is not 100%. The lower, “unvaccinated” histograms show a single mound. The thing to notice about the effect of the new variant is that in this (imaginary) case it has had essentially no effect on the vaccinated histograms, whereas it has shifted the unvaccinated histograms to the right—to higher viral loads, that is. If we were to see this sort of pattern, we would know, with very high confidence, and within a week or two of the new variant’s genome’s publication, that while the variant produces higher viral loads (and therefore potentially more serious clinical outcomes) in unvaccinated patients, the vaccines’ protectiveness is safe, and that the world had dodged another bullet.
Now, suppose instead that we were to see this:
Again, I made this data up. Here, the bottom “unvaccinated” panels tell the same story as before. But the story of the top, “vaccinated” panels has changed dramatically: after the variant showed up, the peak at low viral load is gone. Vaccinated people who were infected with this variant are clearly not fighting off the infection as they had been infections of previous variants. The vaccines’ protective efficacy is in serious trouble. It’s time to dial the new variant’s code into the mRNA vaccines at Moderna and Pfizer, and to warn people to stay the hell out of the way of this thing. And so on.
The point is that at the rate the pandemic produces positive tests, and at the rate and low cost that next-generation sequencing (NGS) can ID variants, we could have such histograms with millions of points in them in a week or two. And we could cut them in other ways: by hospitalization status or death, by age, by ethnicity, and so on. It’s a potentially incredibly rich and powerful dataset that would afford us a clarity of vision into the pandemic unlike anything we have had to date.
And in the USA, at least, we are extremely unlikely to ever see this data.
Why We Can’t Have Nice Things
So, why do testing labs and hospitals not supply Ct with positive tests?
Well, as I said earlier, there is some clinical bias against the utility of Ct as a patient-level measure, but that really is not a good explanation. I have heard (anectdata alert) that some labs do supply Ct, and I have witnessed one test result from a lab in Mexico that actually furnished it. However that may be, at this point labs in the US have made investments in equipment and software and personnel training, and there’s no upside to any particular lab to make a change to their reporting procedures just because some annoying data scientist is nagging them about it, and the downsides include some expense as well as risk from errors that can be expected when such changes are introduced to mass processes such as public RT-PCR testing for COVID-19. So it won’t happen spontaneously as a lab-led movement.
How did labs decide what to report in the first place, though? Well, in the USA the Federal authority responsible for creating the testing standard is the Centers for Disease Control (CDC). The CDC issued its first testing protocol in early 2020. The protocol was updated in August 2020, to create a “multiplexed” test that simultaneously checks for SARS-CoV-2 and for flu.
There is a very detailed instruction manual for the test available as a pdf. The detail is actually kind of eye-watering, but all the labs had to read it, so I also read it (or at least skimmed through it), and I must say that for the most part I found it to be an extremely impressive document. It is perfectly clear that the people who wrote it understood that their job was to take a complex biochemistry lab procedure, usually performed by PhD (or PhD candidate) scientists, and break it down into simple, manageable, nearly error-proof steps, so that the procedure might be performed by hourly wage technicians and repeated millions of times per week, week after week, with as few errors as possible. In my opinion they succeeded so well that I found myself thinking that even I might be able to perform this assay, with proper training (and no neighborhood evacuation might be required). Which is to say, most of this document has the earmarks of the highest professional standards.
But then I got to the part that I was looking for, the part about result reporting. Here I was expecting to find a bit of a let-down: something along the lines of “report a positive or a negative result, and shove the Ct value in a file somewhere”. That would have been bad enough. But the truth is actually worse.
Table 10, on p. 30 (“Flu SC2 Multiplex Assay Interpretation”) tabulates possible outcomes, and the duties of the lab in each case. Which, in the case of every type of “positive” (Influenza A or B, COVID-19, or some combination) reads, in its entirety “Report results to sender”. I kid you not. That’s it. That is all the CDC has to say about what a lab must communicate about the assay that it has just performed. There’s a bit of verbiage on using standards-based “coding and vocabulary” for reporting (there are on-line resources for standard terminology that should be used). But on the substance of the test, that’s it. “Report”. Not report what, just report. The CDC never took the trouble to instruct labs on what to report! They just went to a herculean effort to lay out an idiot-proofed version of this insanely complex assay, then, right at the end, acted as if the actual results of the assay were a matter of indifference.
And that’s the problem with the CDC. This is not an agency that has the remotest understanding of the importance of data, in the modern sense, and certainly has no internal culture of data science. There was no member of the institution sitting at the table when those instructions were written who was capable of understanding, much less pointing out the catastrophic mistake that they were making—that they made twice, once per iteration of this protocol. They totally get the biochemistry—no doubt the Atlanta CDC campus is crawling with biochemists. It’s just data they have no clue about.
The CDC is notoriously conservative, and resistant to change, especially change driven from outside. I would recommend a reading of Michael Lewis’ excellent book The Premonition to gain some insight on the agency’s culture, and how it got that way. In principle you could imagine an irresistible force moving this nearly immovable object. Such a force was easier to imagine in the Obama administration, when the White House Office of Science and Technology Policy (OSTP) established the position of “Chief Data Scientist” (CDS) (held then by DJ Patil). This issue being essentially a data problem, one could fantasize about the White House issuing strong “suggestions” to CDC emanating from OSTP to correct this obvious flaw in the protocol. But unfortunately the Biden administration’s OSTP has not created a CDS role, so it is not clear that there is someone at OSTP who would necessarily own this problem to the extent necessary to move the extremely cumbersome Federal machinery.
The bottom line is, this protocol is unlikely to get fixed in the USA. And fixing it is really the only way to make labs supply the data that we need to stop flying blind in this pandemic. Which more of a minor-key tone than I prefer to end one of these essays on.
So perhaps we can reflect on the fact that the USA is, after all, not the World (this may not be as much of a revelation to non-US-readers :-|). There is a WHO with its own standards, after all, and various national authorities have shown encouraging scientific leadership in various aspects of epidemic surveillance—for example the UK’s genomic surveillance effort is a gem, and unmatched anywhere, so far as I am aware. So perhaps at some point some locations in the world will pry this window open. And maybe it will even be soon enough to prevent us from flying into a building. One can always hope.